Getting Started
What is webRoid?
webRoid is a native Android app that brings a nearly full-featured R environment to your phone or tablet. It uses webR, a port of R compiled to WebAssembly, so everything runs locally on your device. No server, no accounts to create, and no internet connection once your packages are installed. You get an interactive R console, a code editor, plotting, environment inspection, file management, and package installation, all in a single app.
Because webRoid runs R through WebAssembly, some limitations apply compared to desktop R. Not all CRAN packages are available, and certain workflows (R package development, compiled code) are not supported. See the FAQ for details.
If you have used R before, you already know how to use webRoid. If you are new to R, this is a good place to start experimenting.
Install from Google Play

webRoid is available on the Google Play Store.

The app requires Android 15 (API level 35) or later. It works on phones and tablets. No special hardware needed.
First Launch
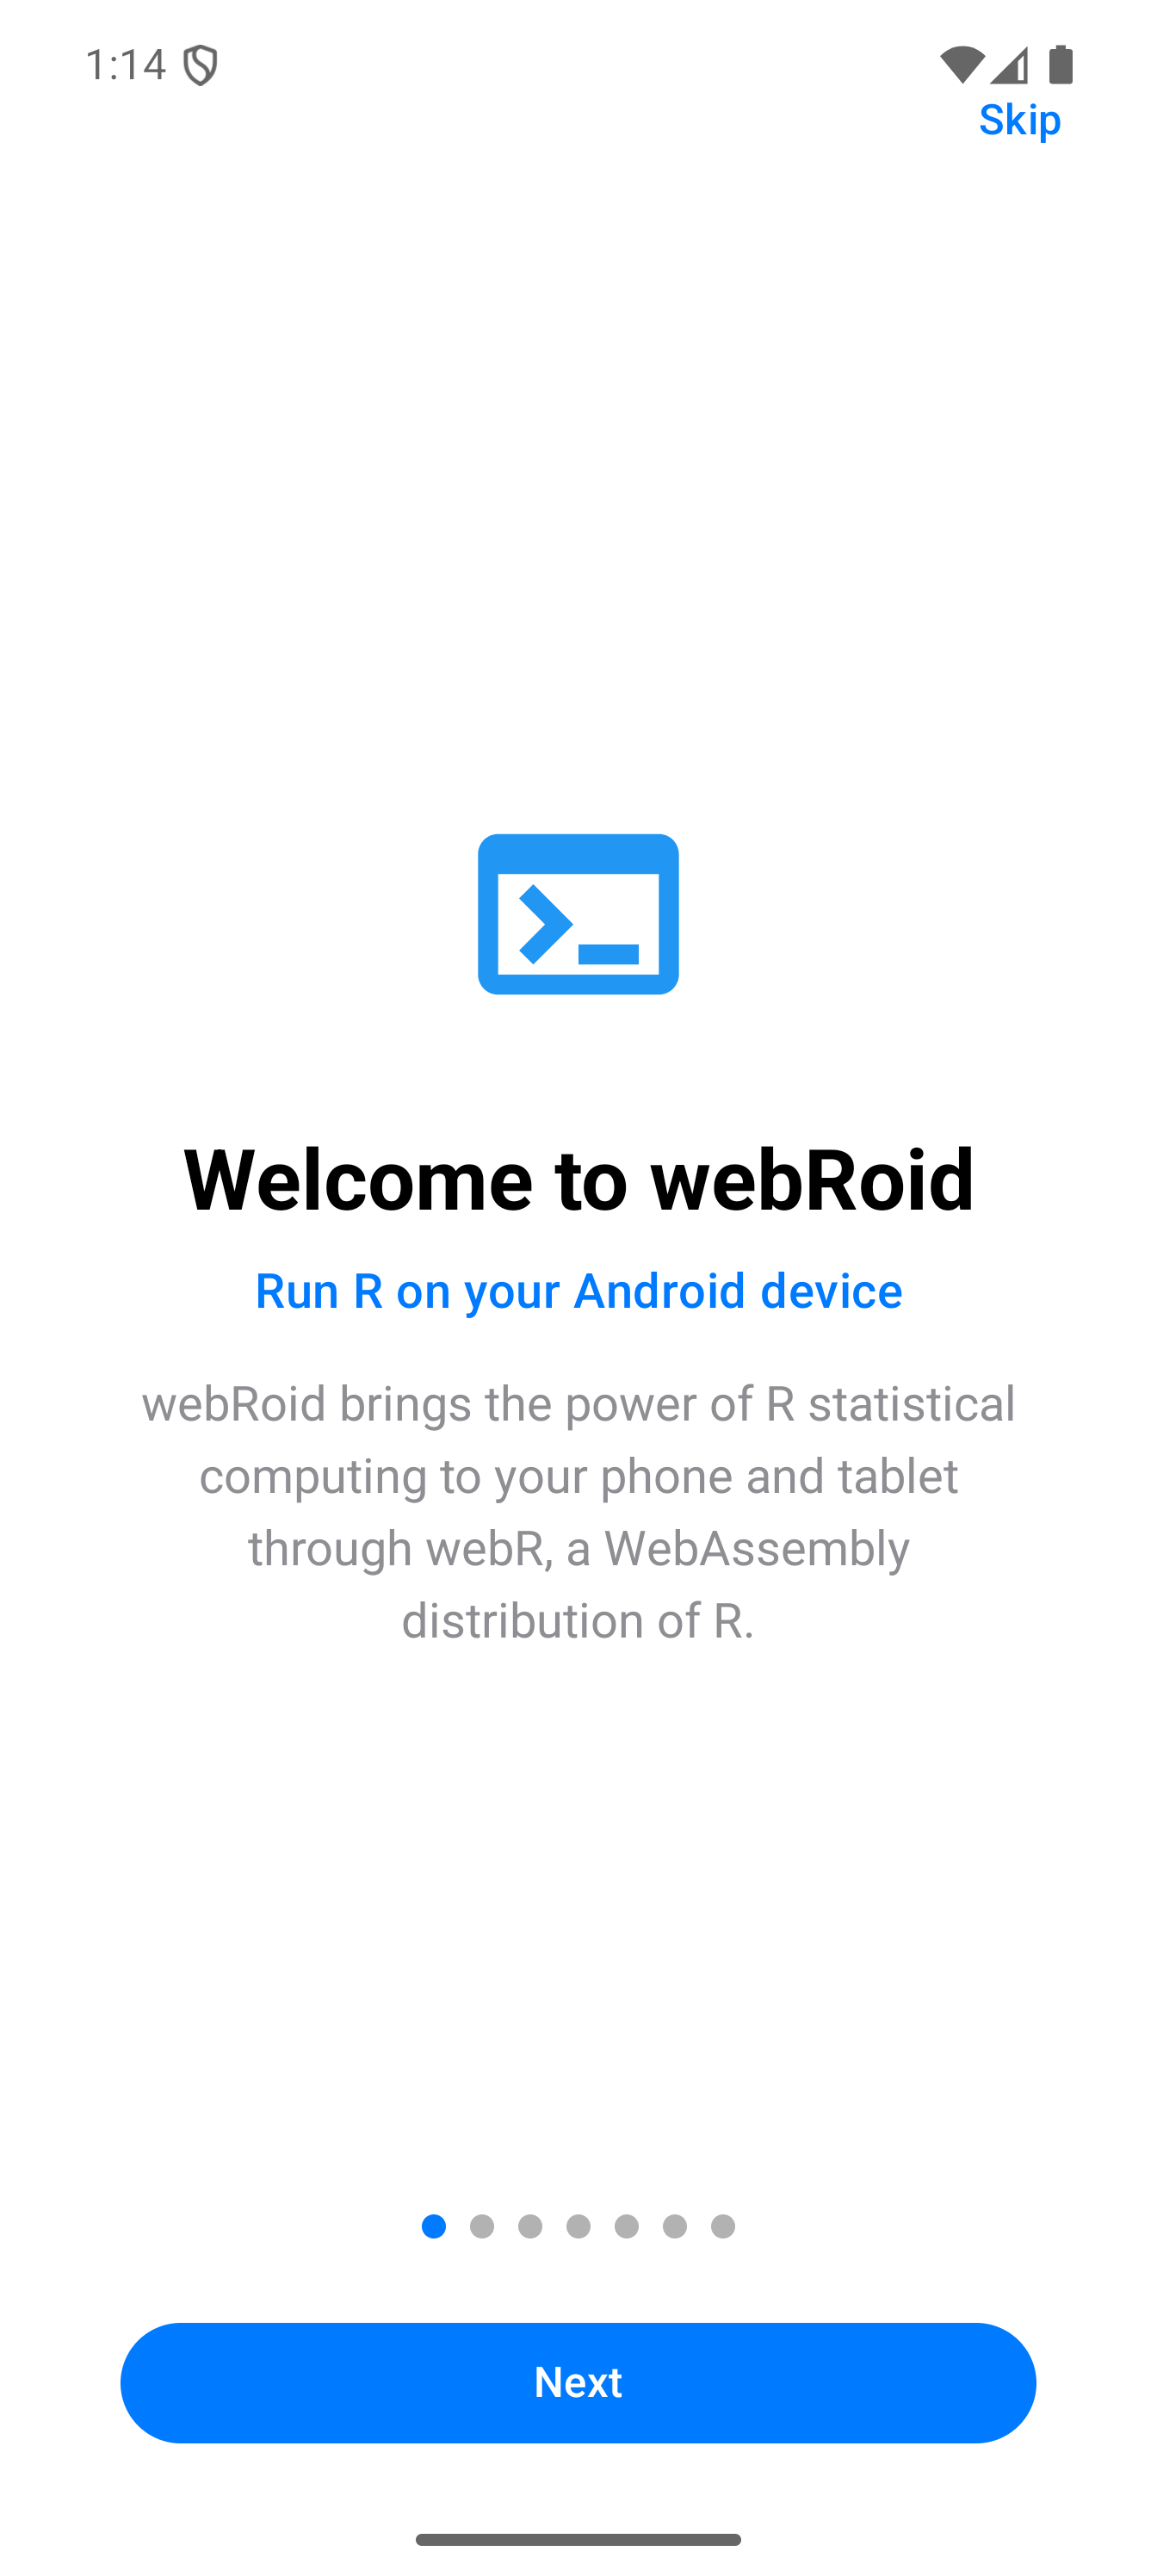
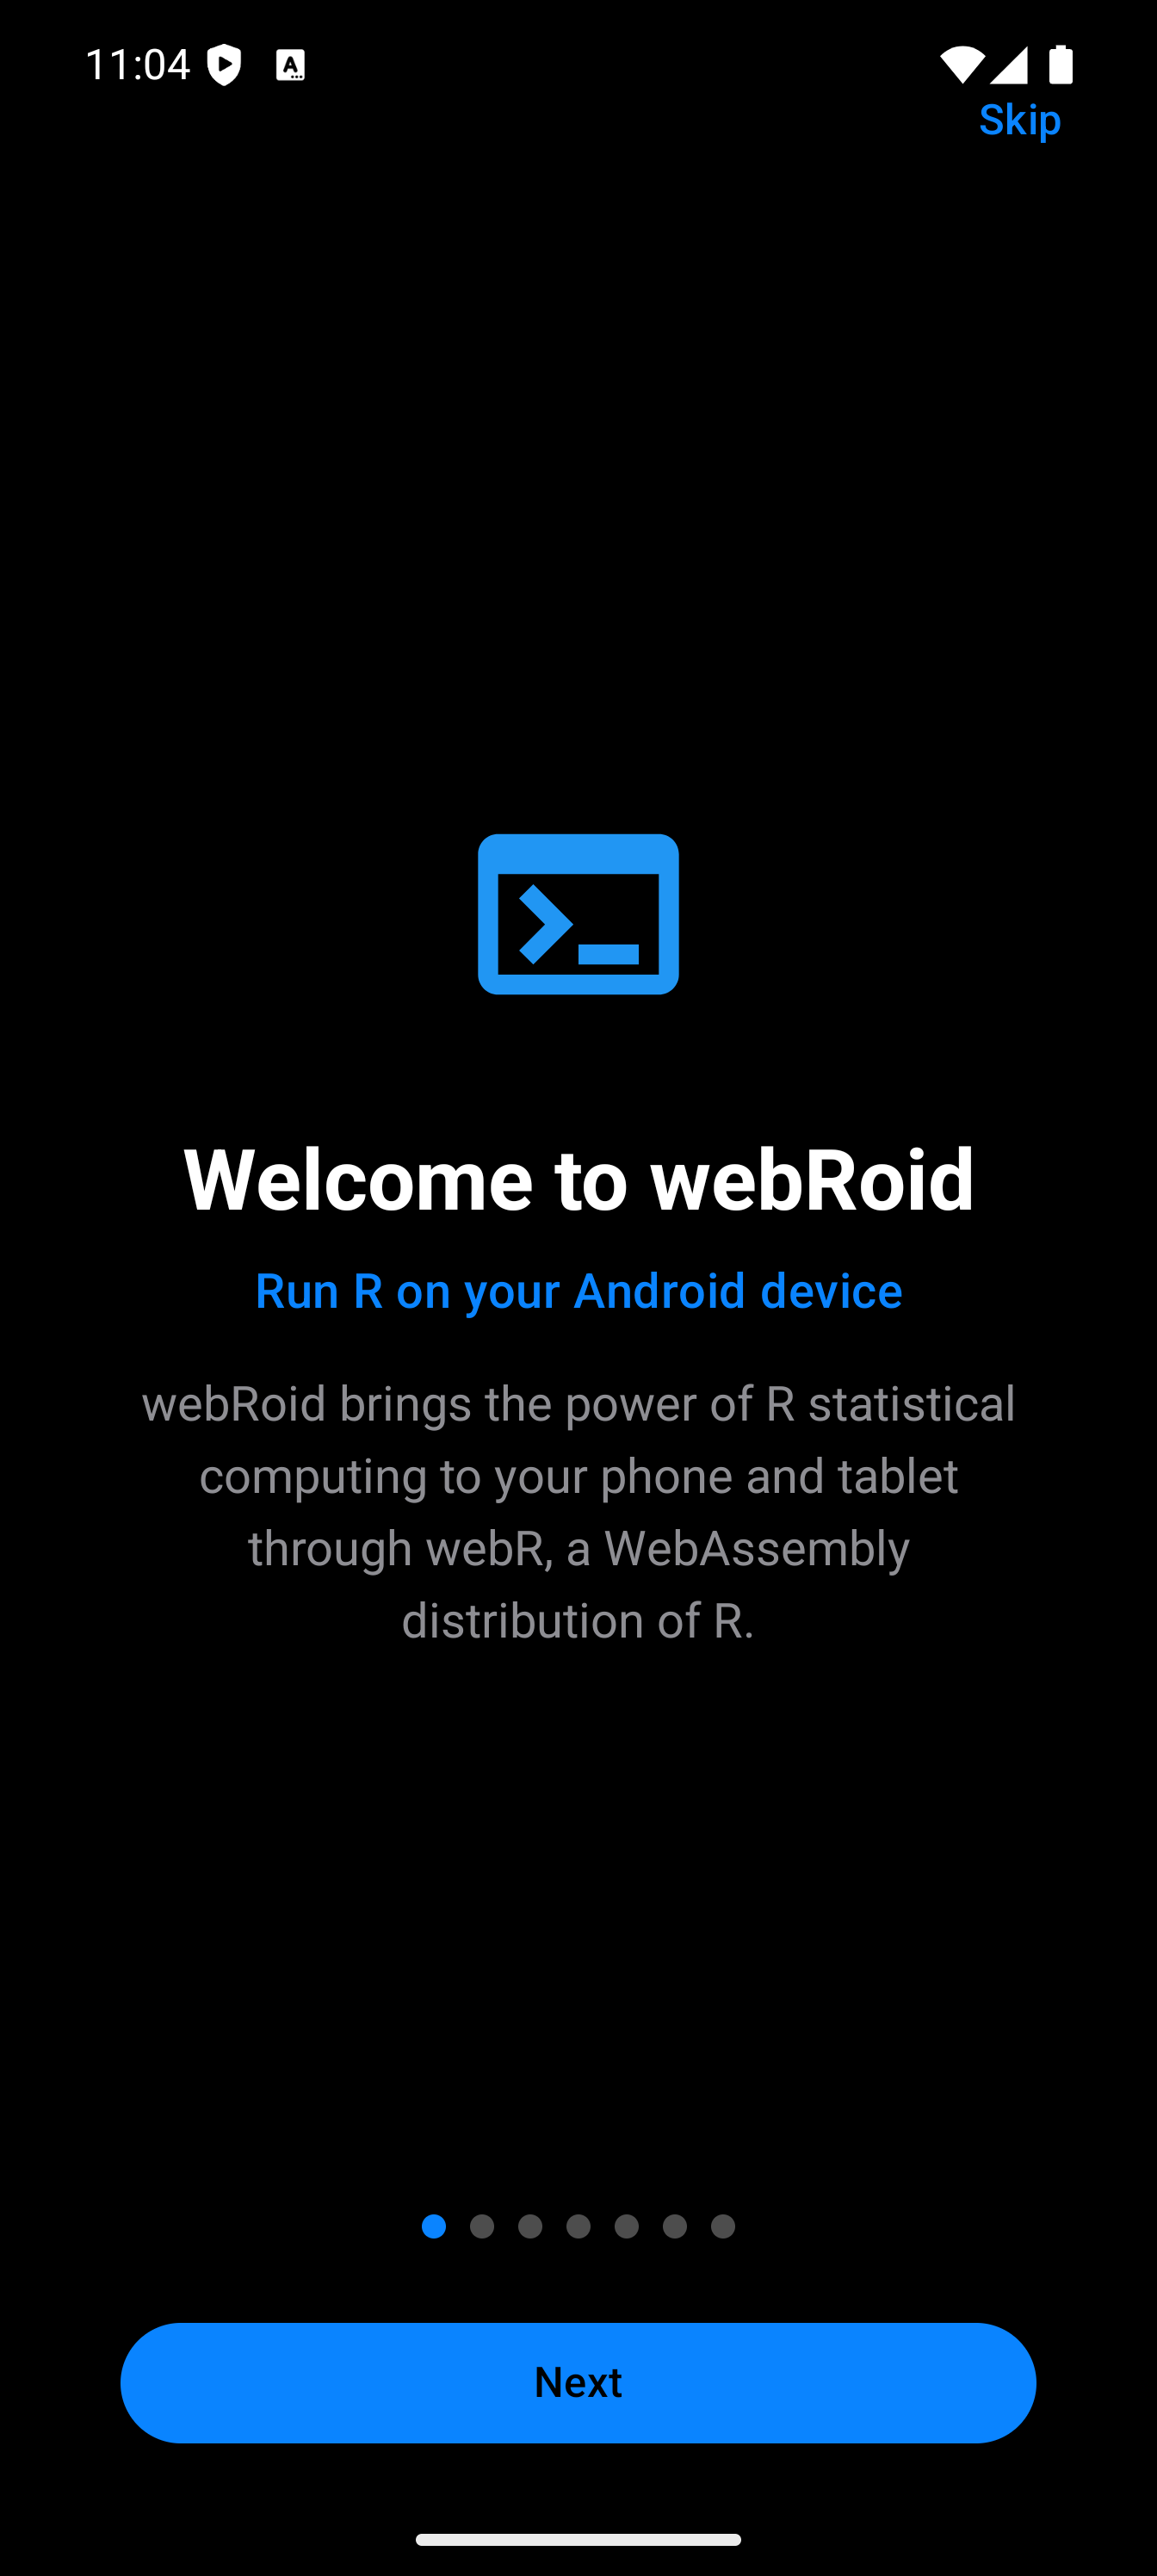
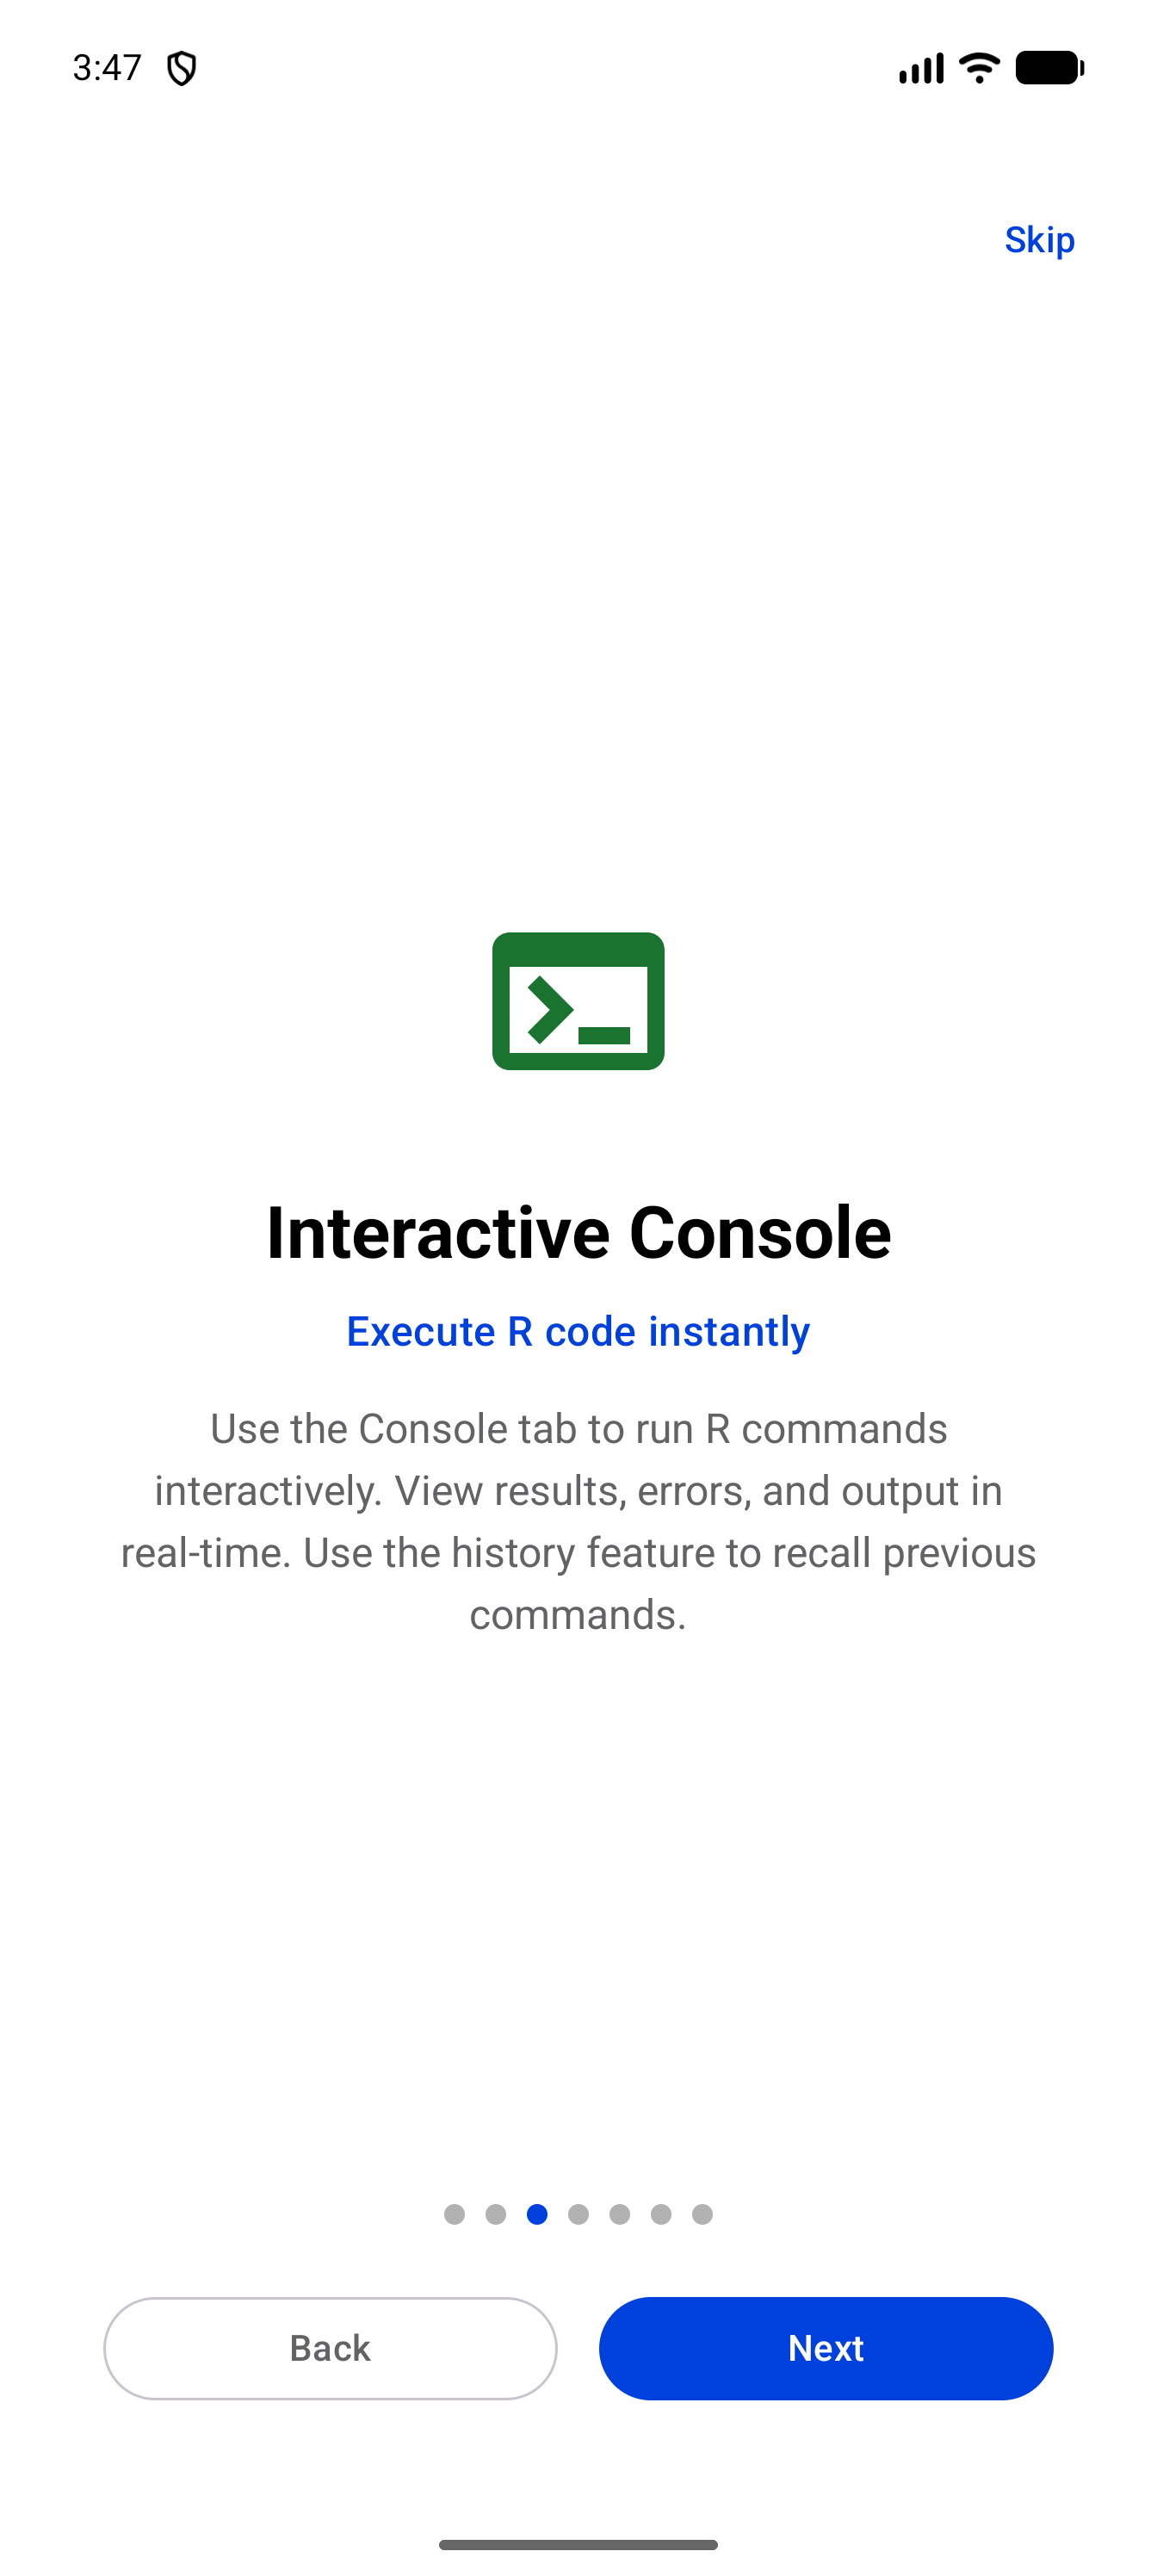
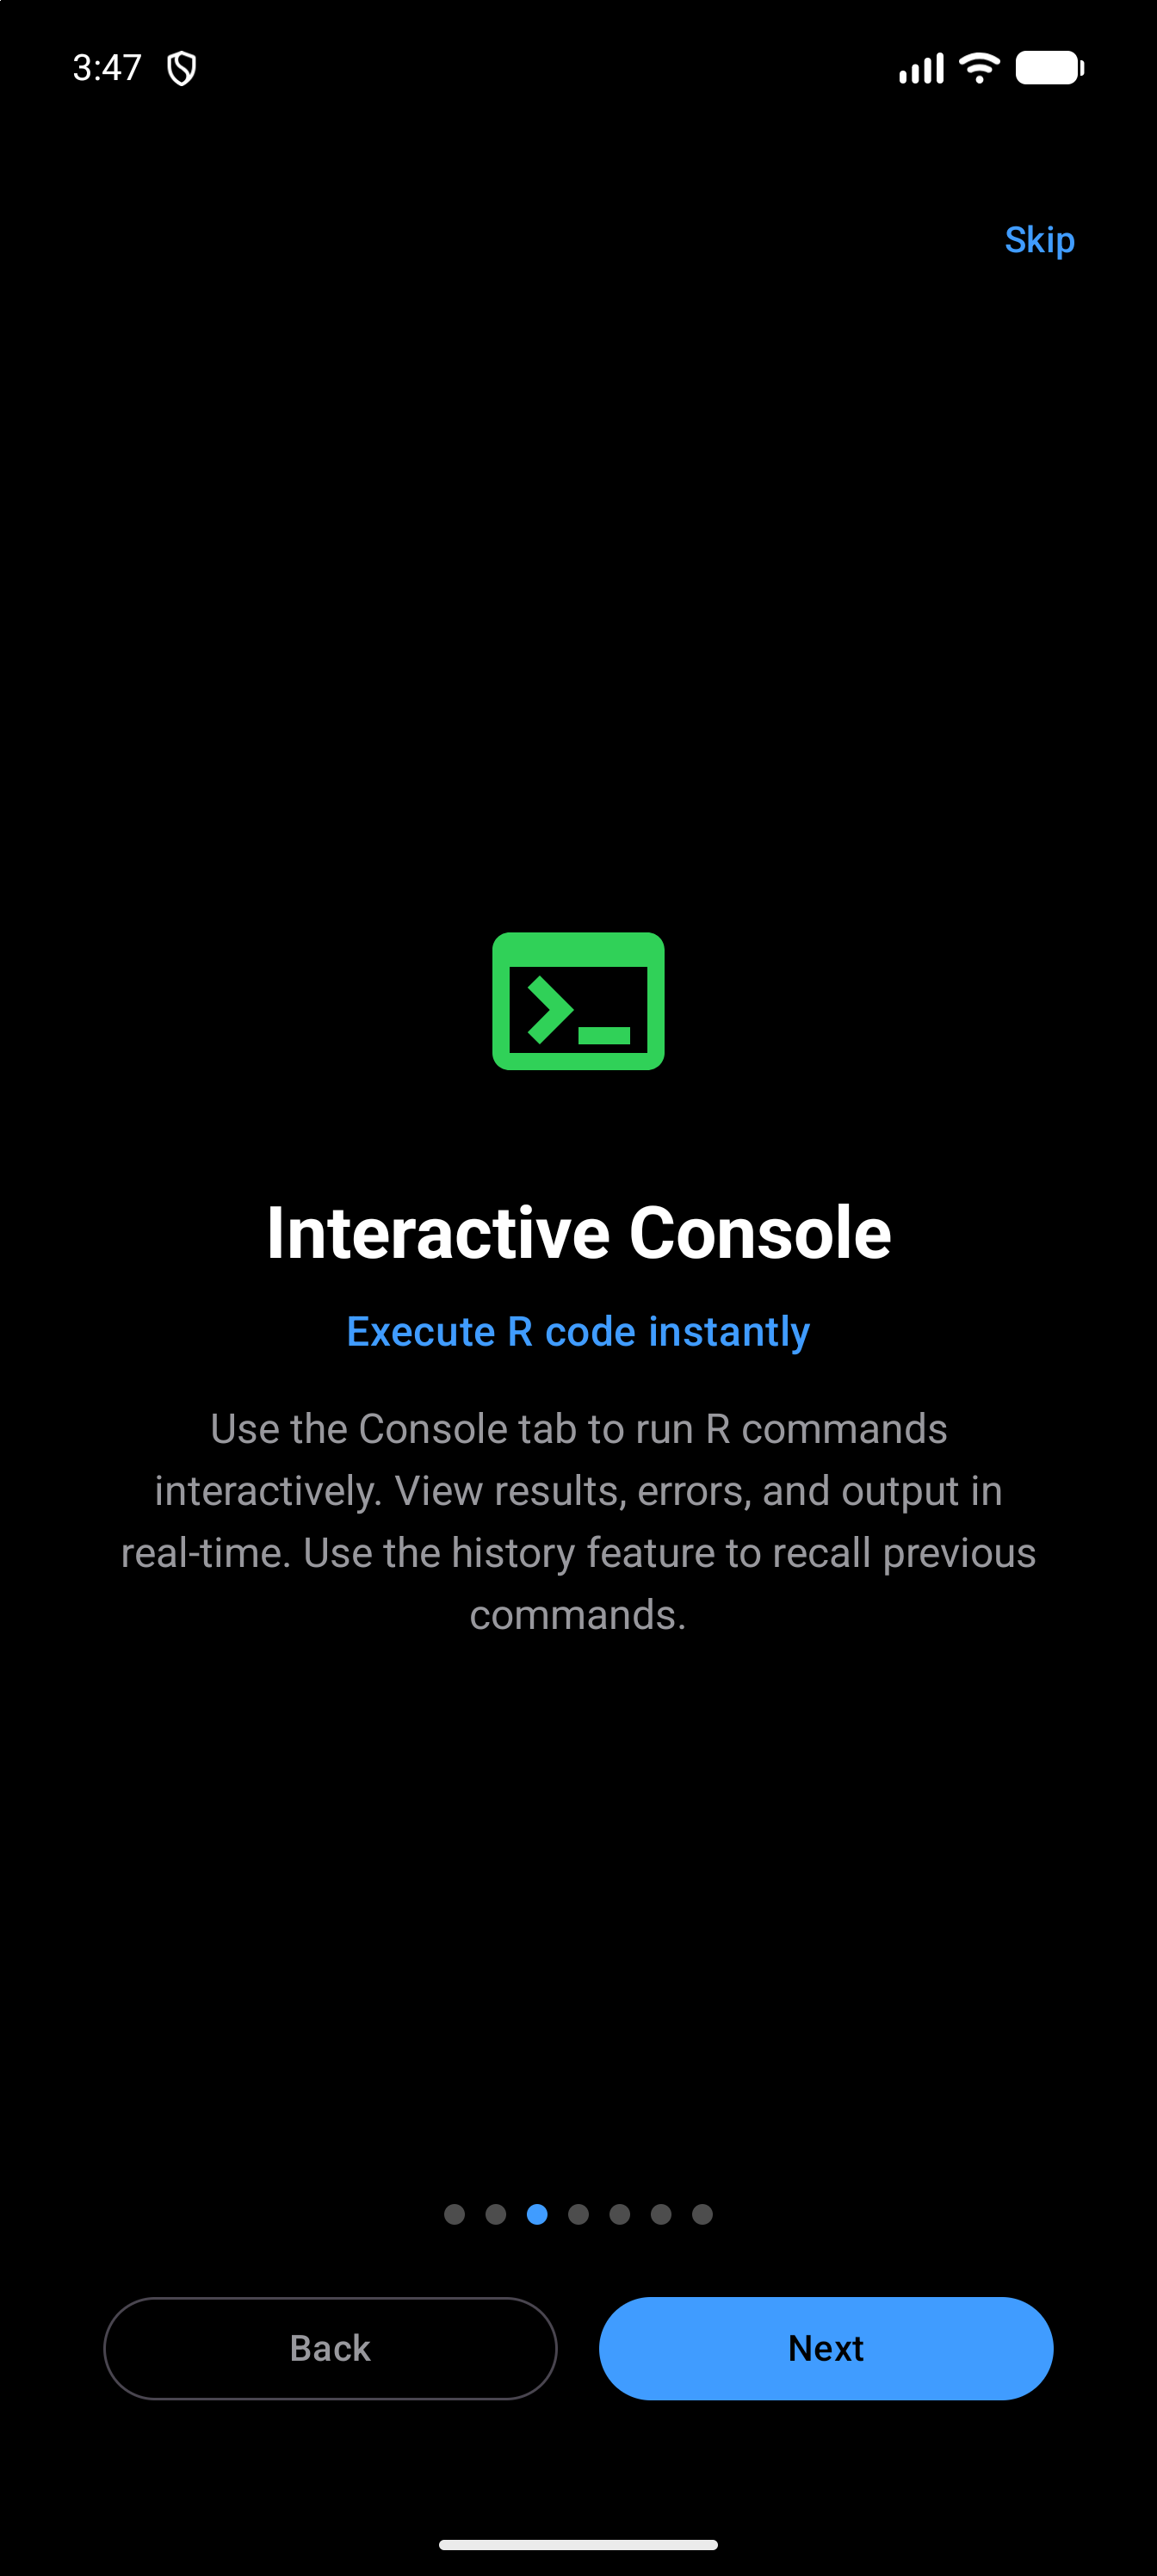
When you open webRoid for the first time, you will see a short onboarding sequence of seven pages that introduces the main features of the app and asks you to choose a storage location. Swipe through, or tap Next to advance. A row of dots shows where you are.
| Page | What it covers |
|---|---|
| 1. Welcome to webRoid | What the app is: R on your phone or tablet, through webR |
| 2. Choose a storage location | The one page that asks something of you. See below |
| 3. Interactive Console | Running R commands and recalling earlier ones |
| 4. Code Editor | Writing scripts, syntax highlighting, the R keyboard toolbar |
| 5. Visualizations | Making plots, then zooming, exporting, and sharing them |
| 6. Environment Inspector | Seeing your variables, data frames, and functions |
| 7. Package Manager | Installing packages from the webR repository |
Pages 3 to 7 are read-only introductions; nothing you do on them changes the app.
On the second page, you will be asked to choose a storage location. This is where your projects, scripts and data files live. R works on its own in-memory copy of the active project, so files your R code writes stay in that copy until you save them here with Copy Files Back from R in the Files menu, or turn on Copy Files Back Automatically in Settings > R Session to have them copied after each command you run in the Console; see Files and R.
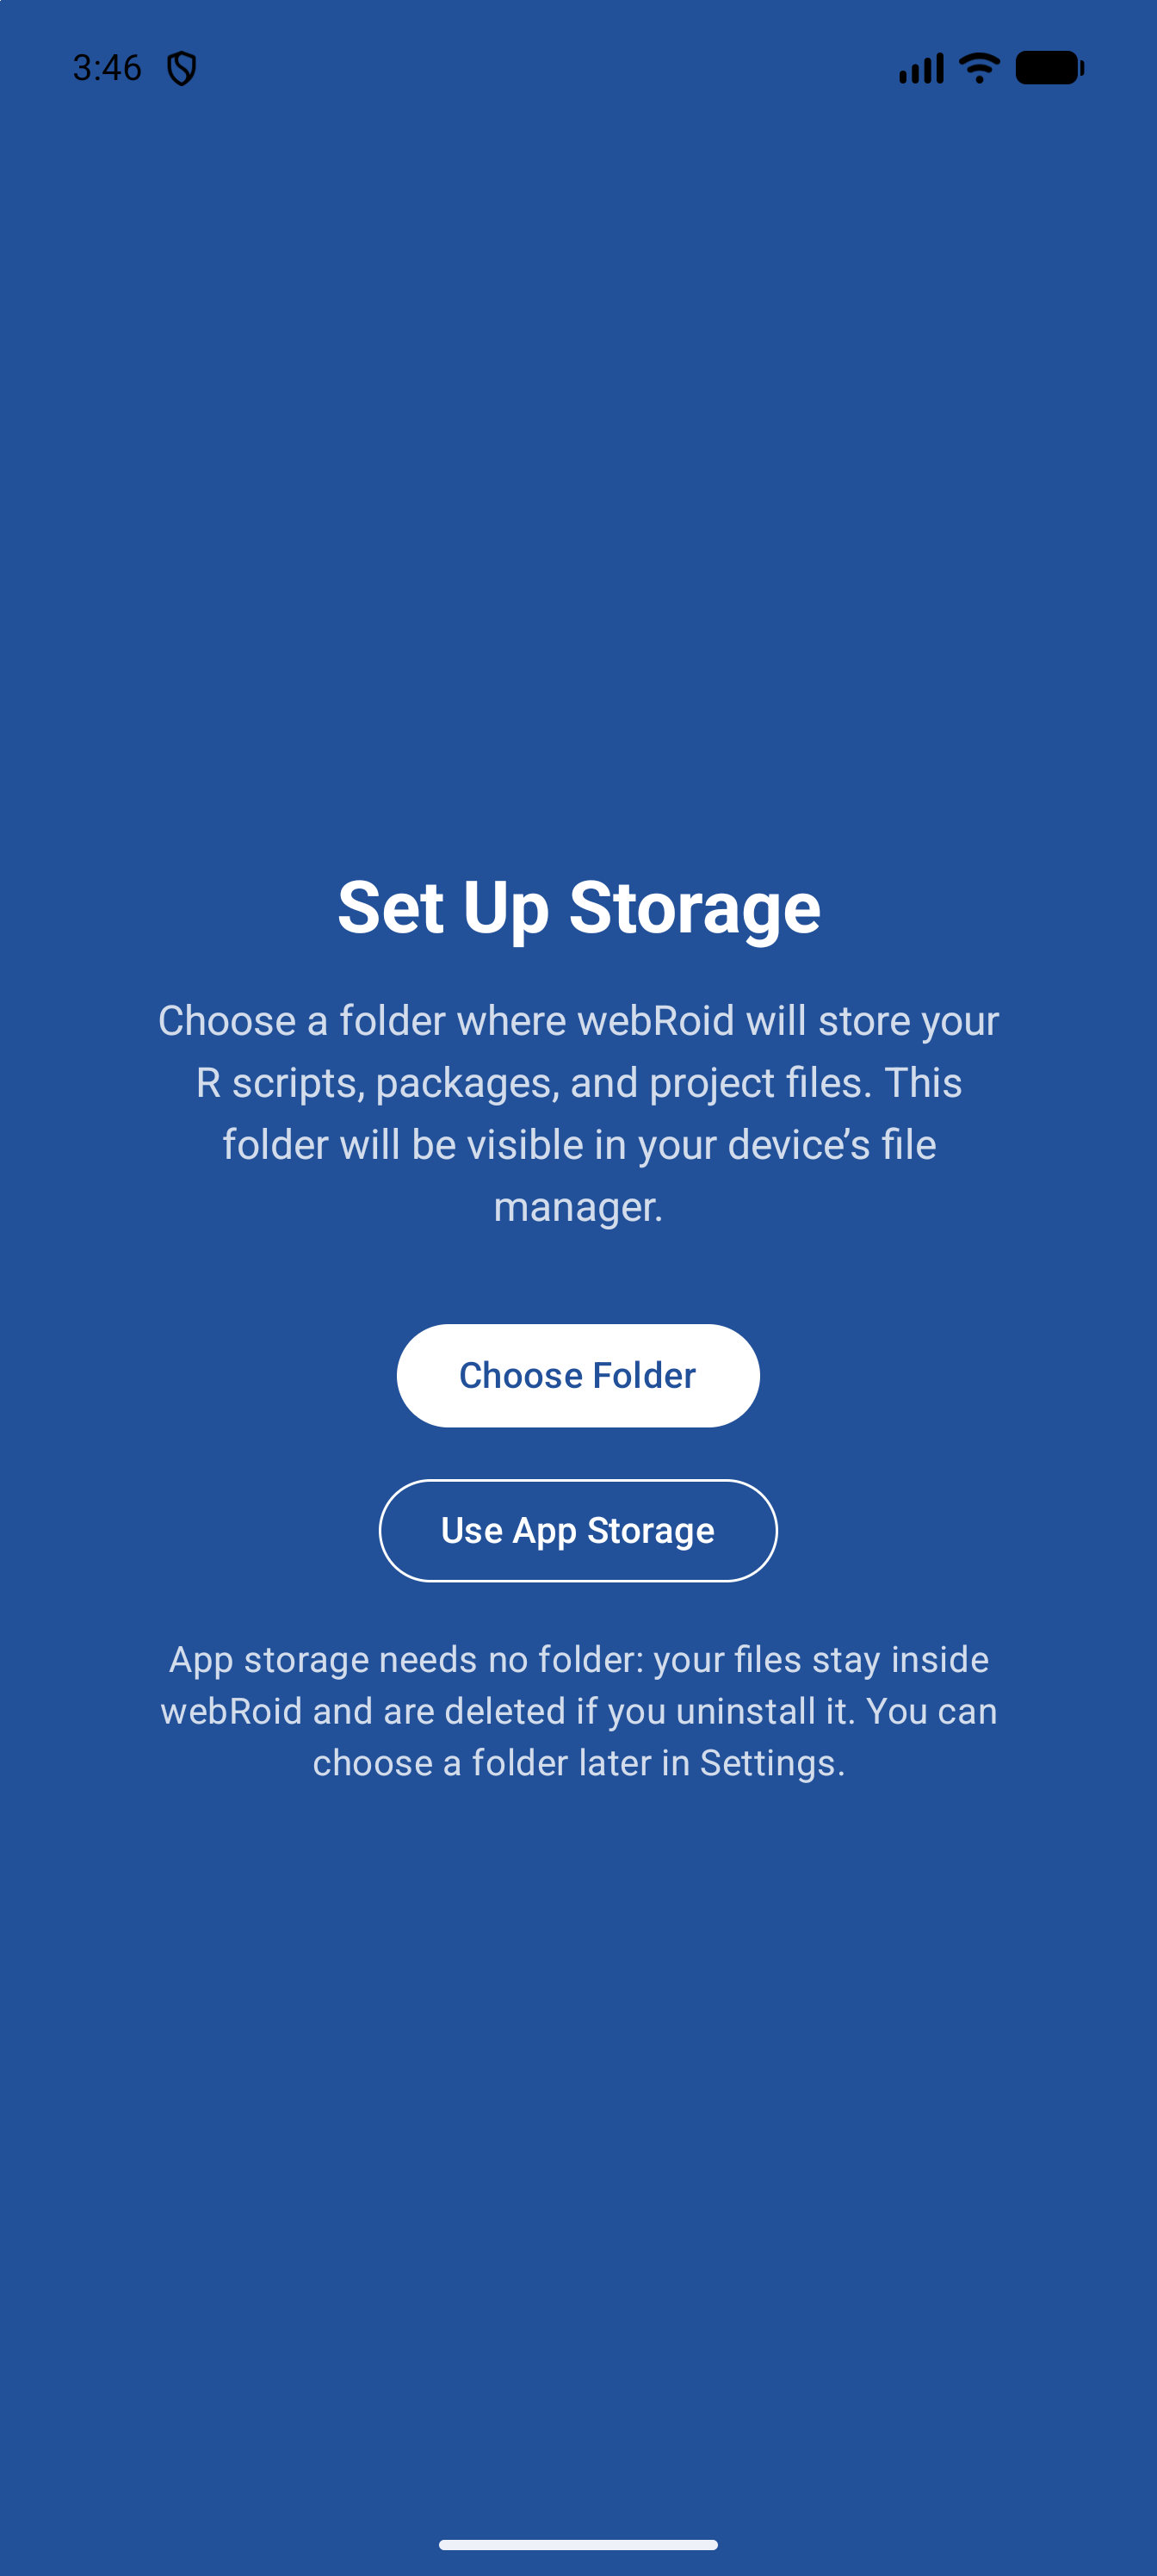
Tap Choose Folder and Android’s own folder picker opens, starting at Documents/webRoid. The path you chose is then shown on the page, with Change Folder if you want a different one.
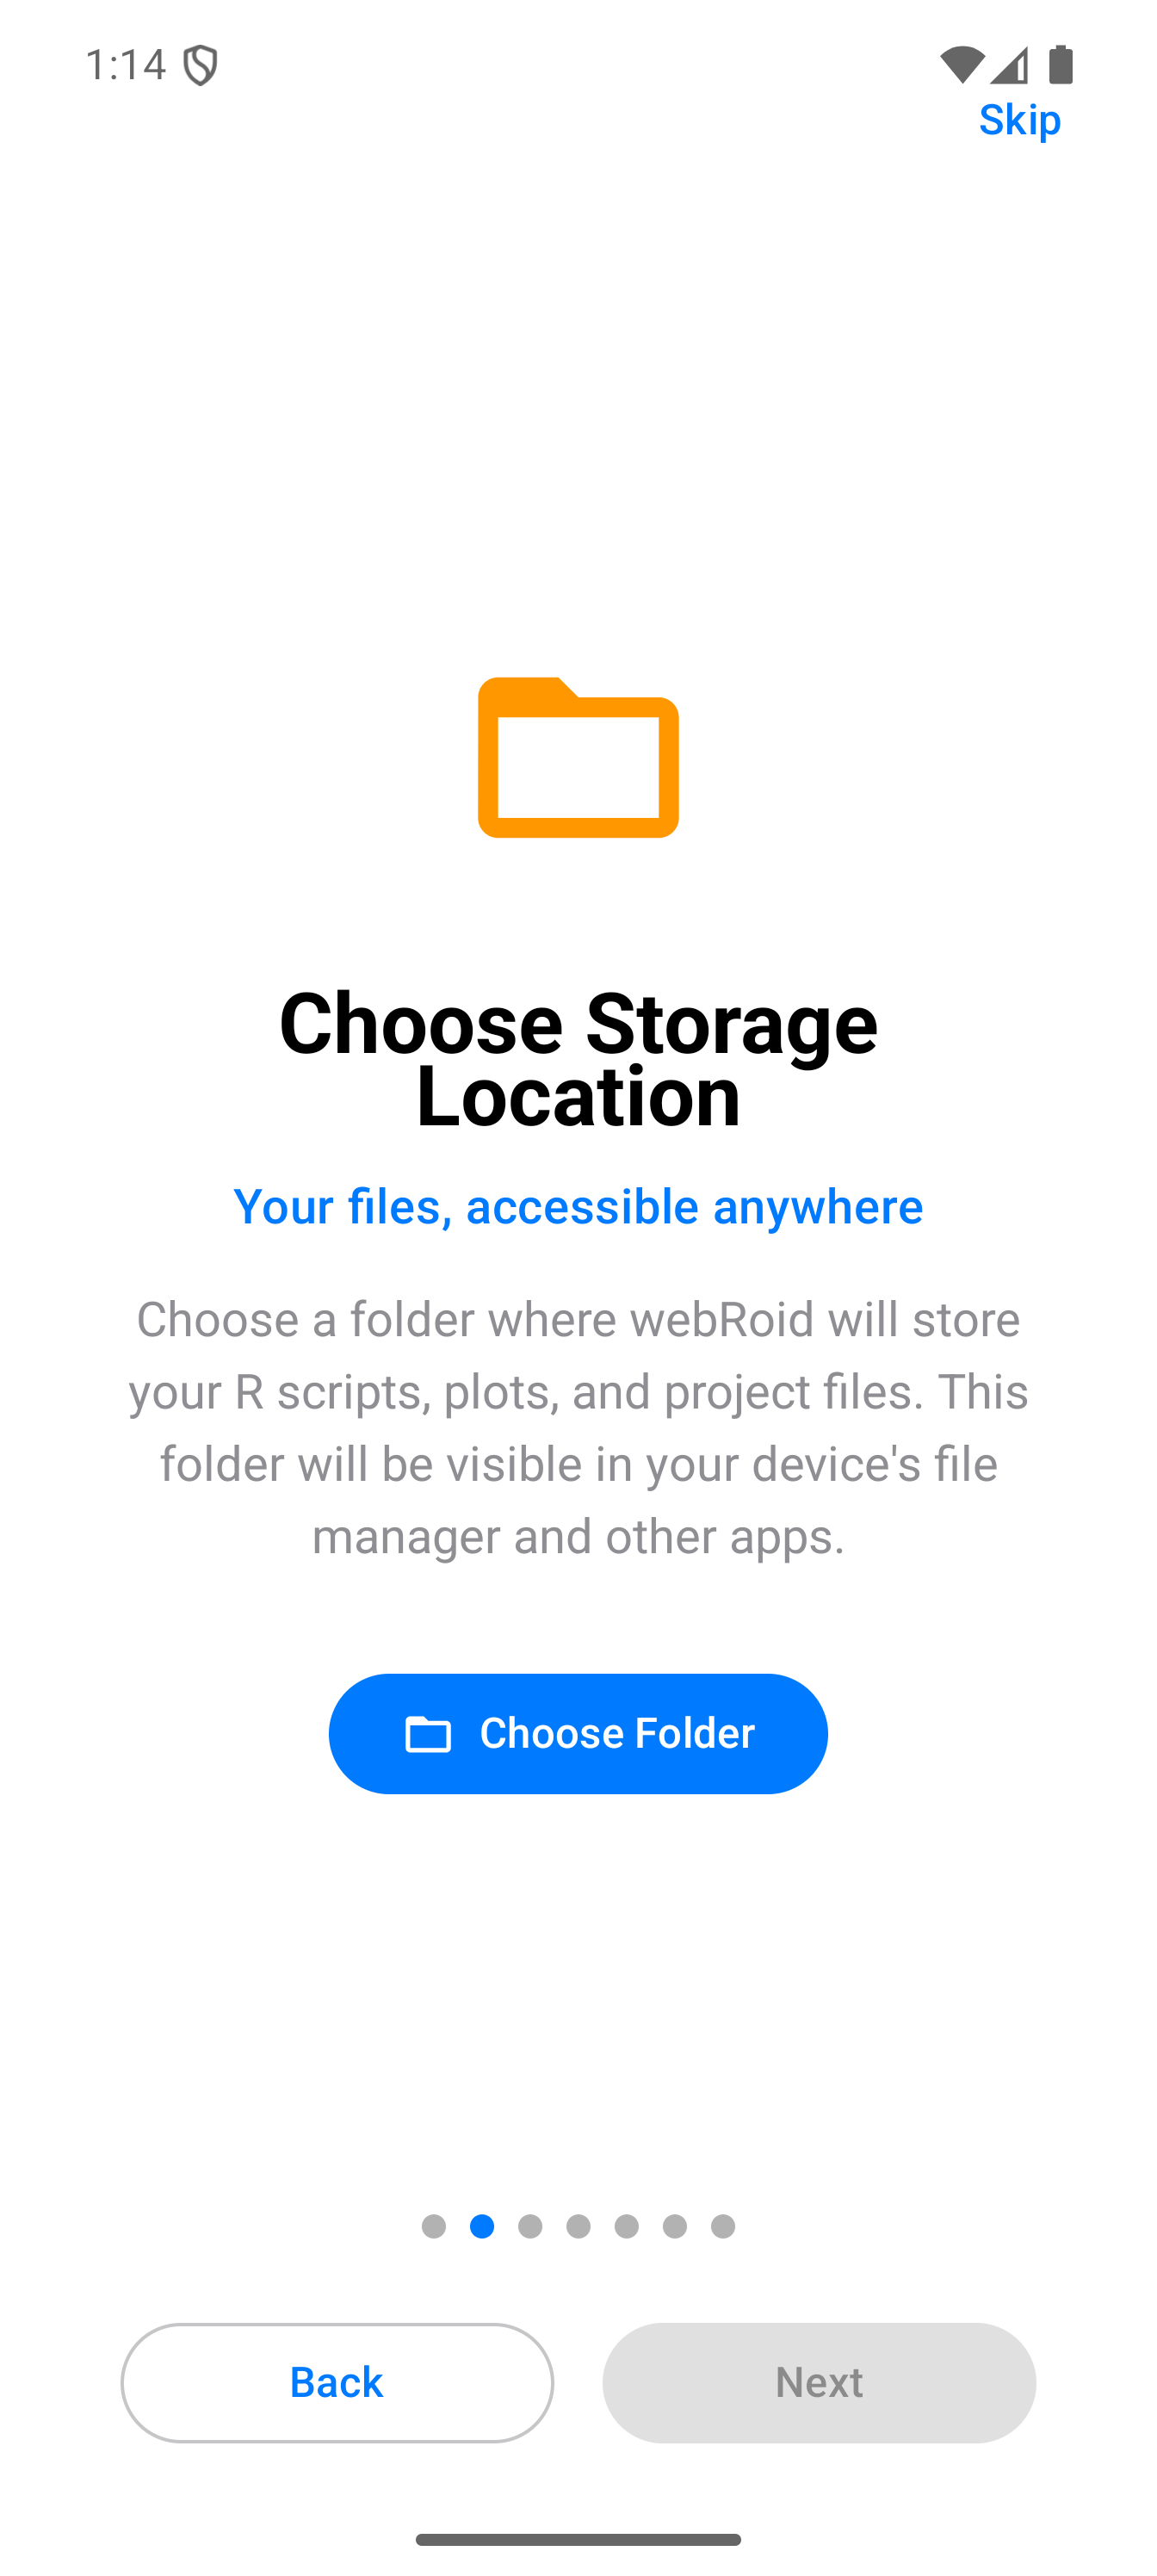
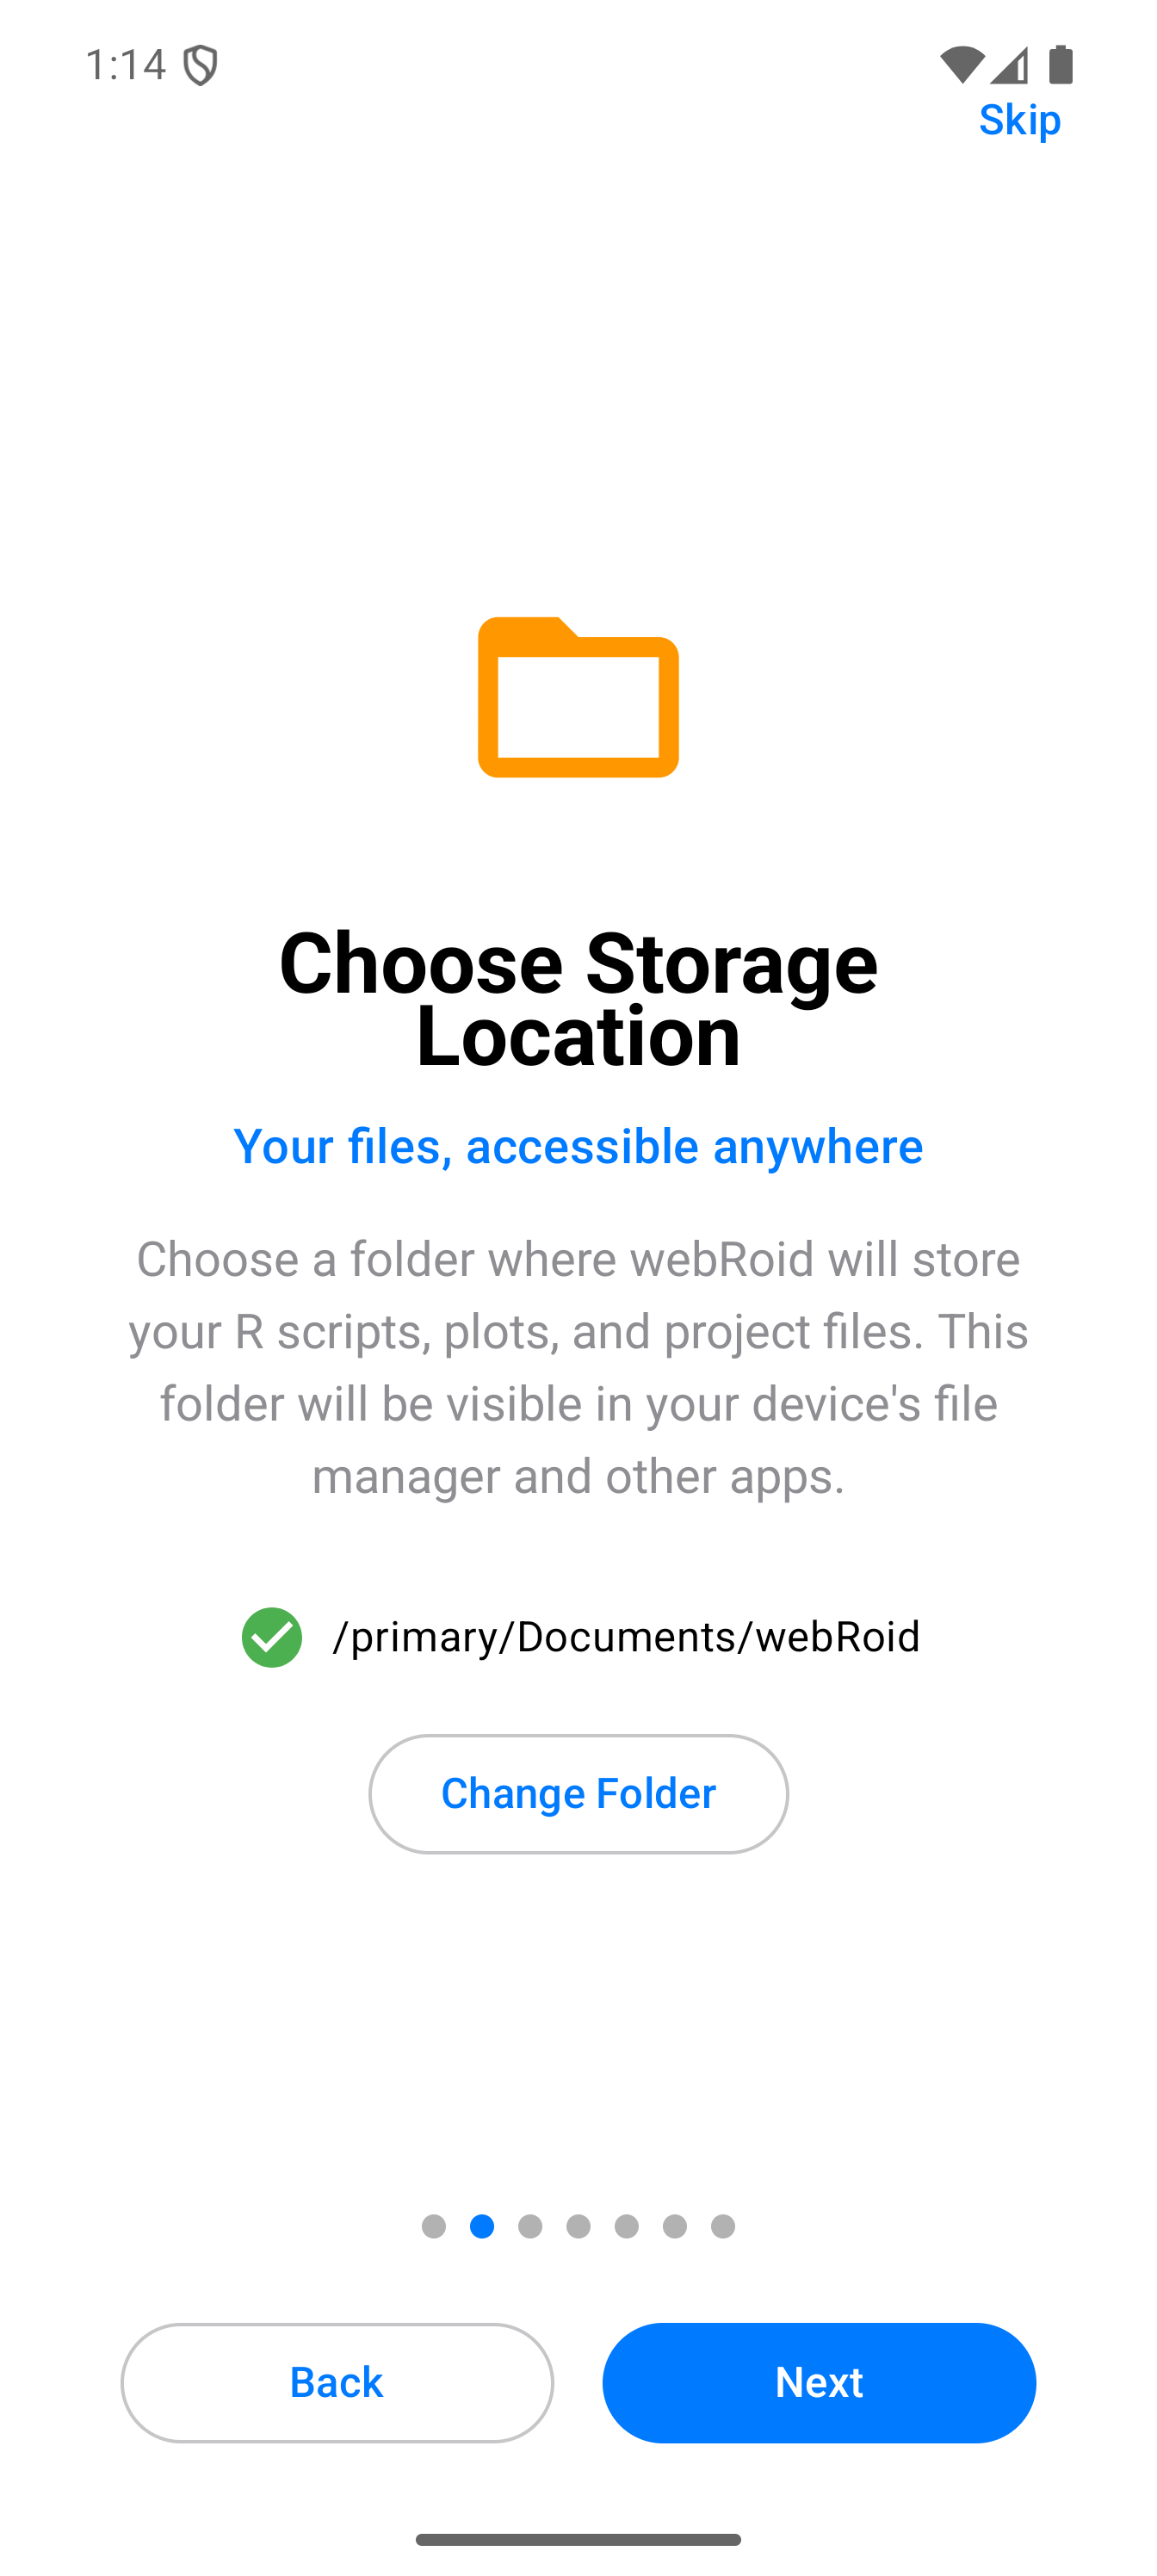
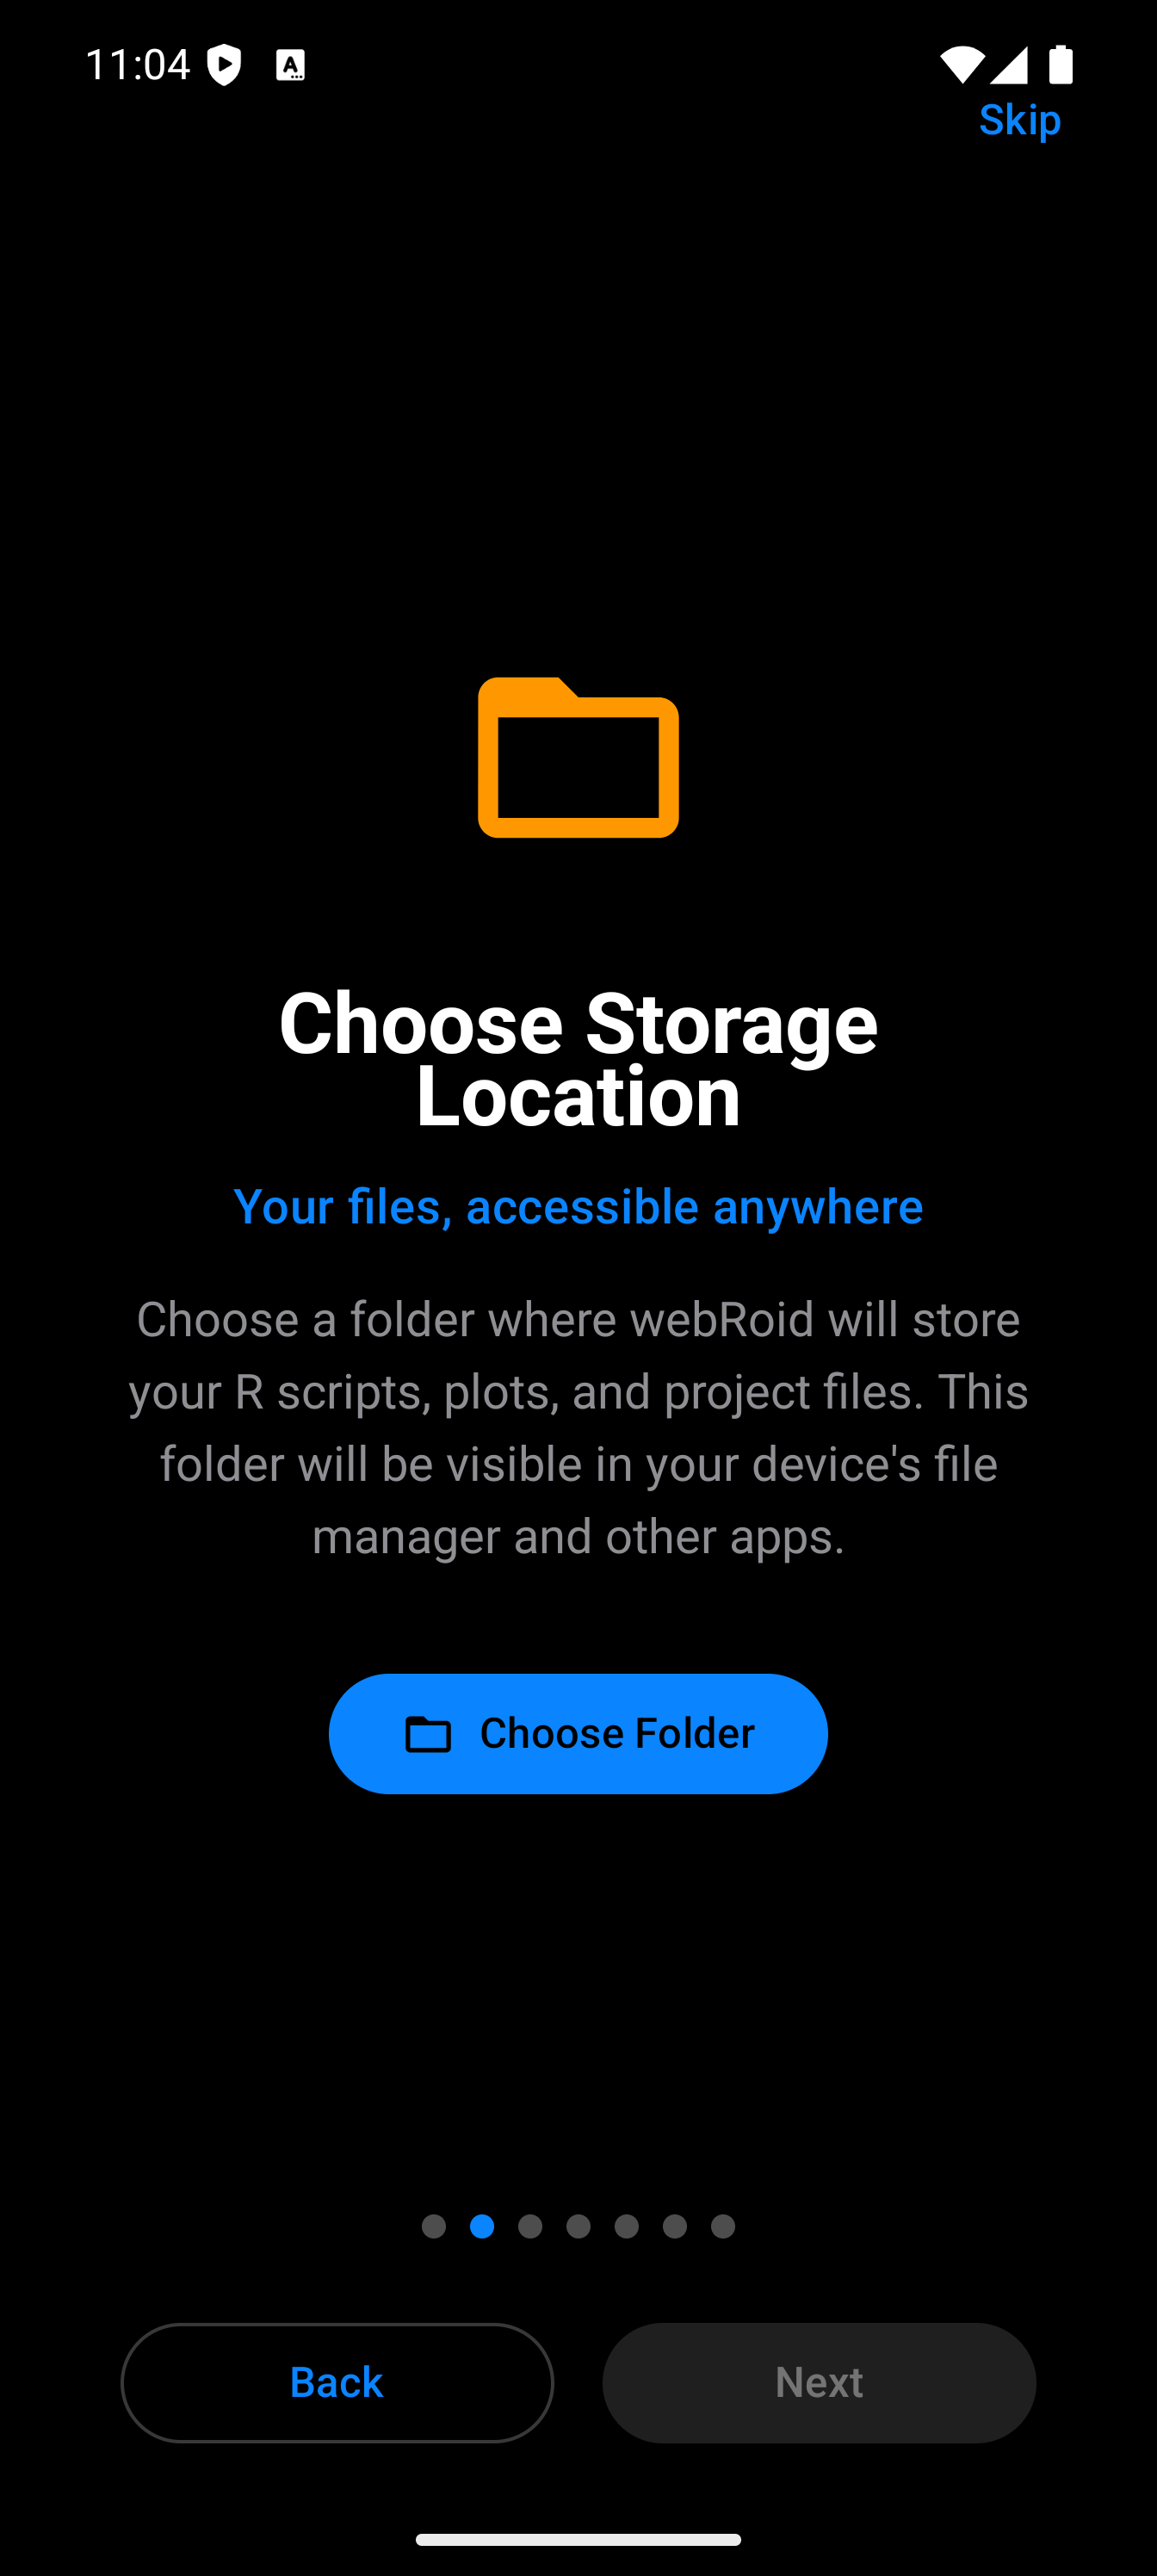
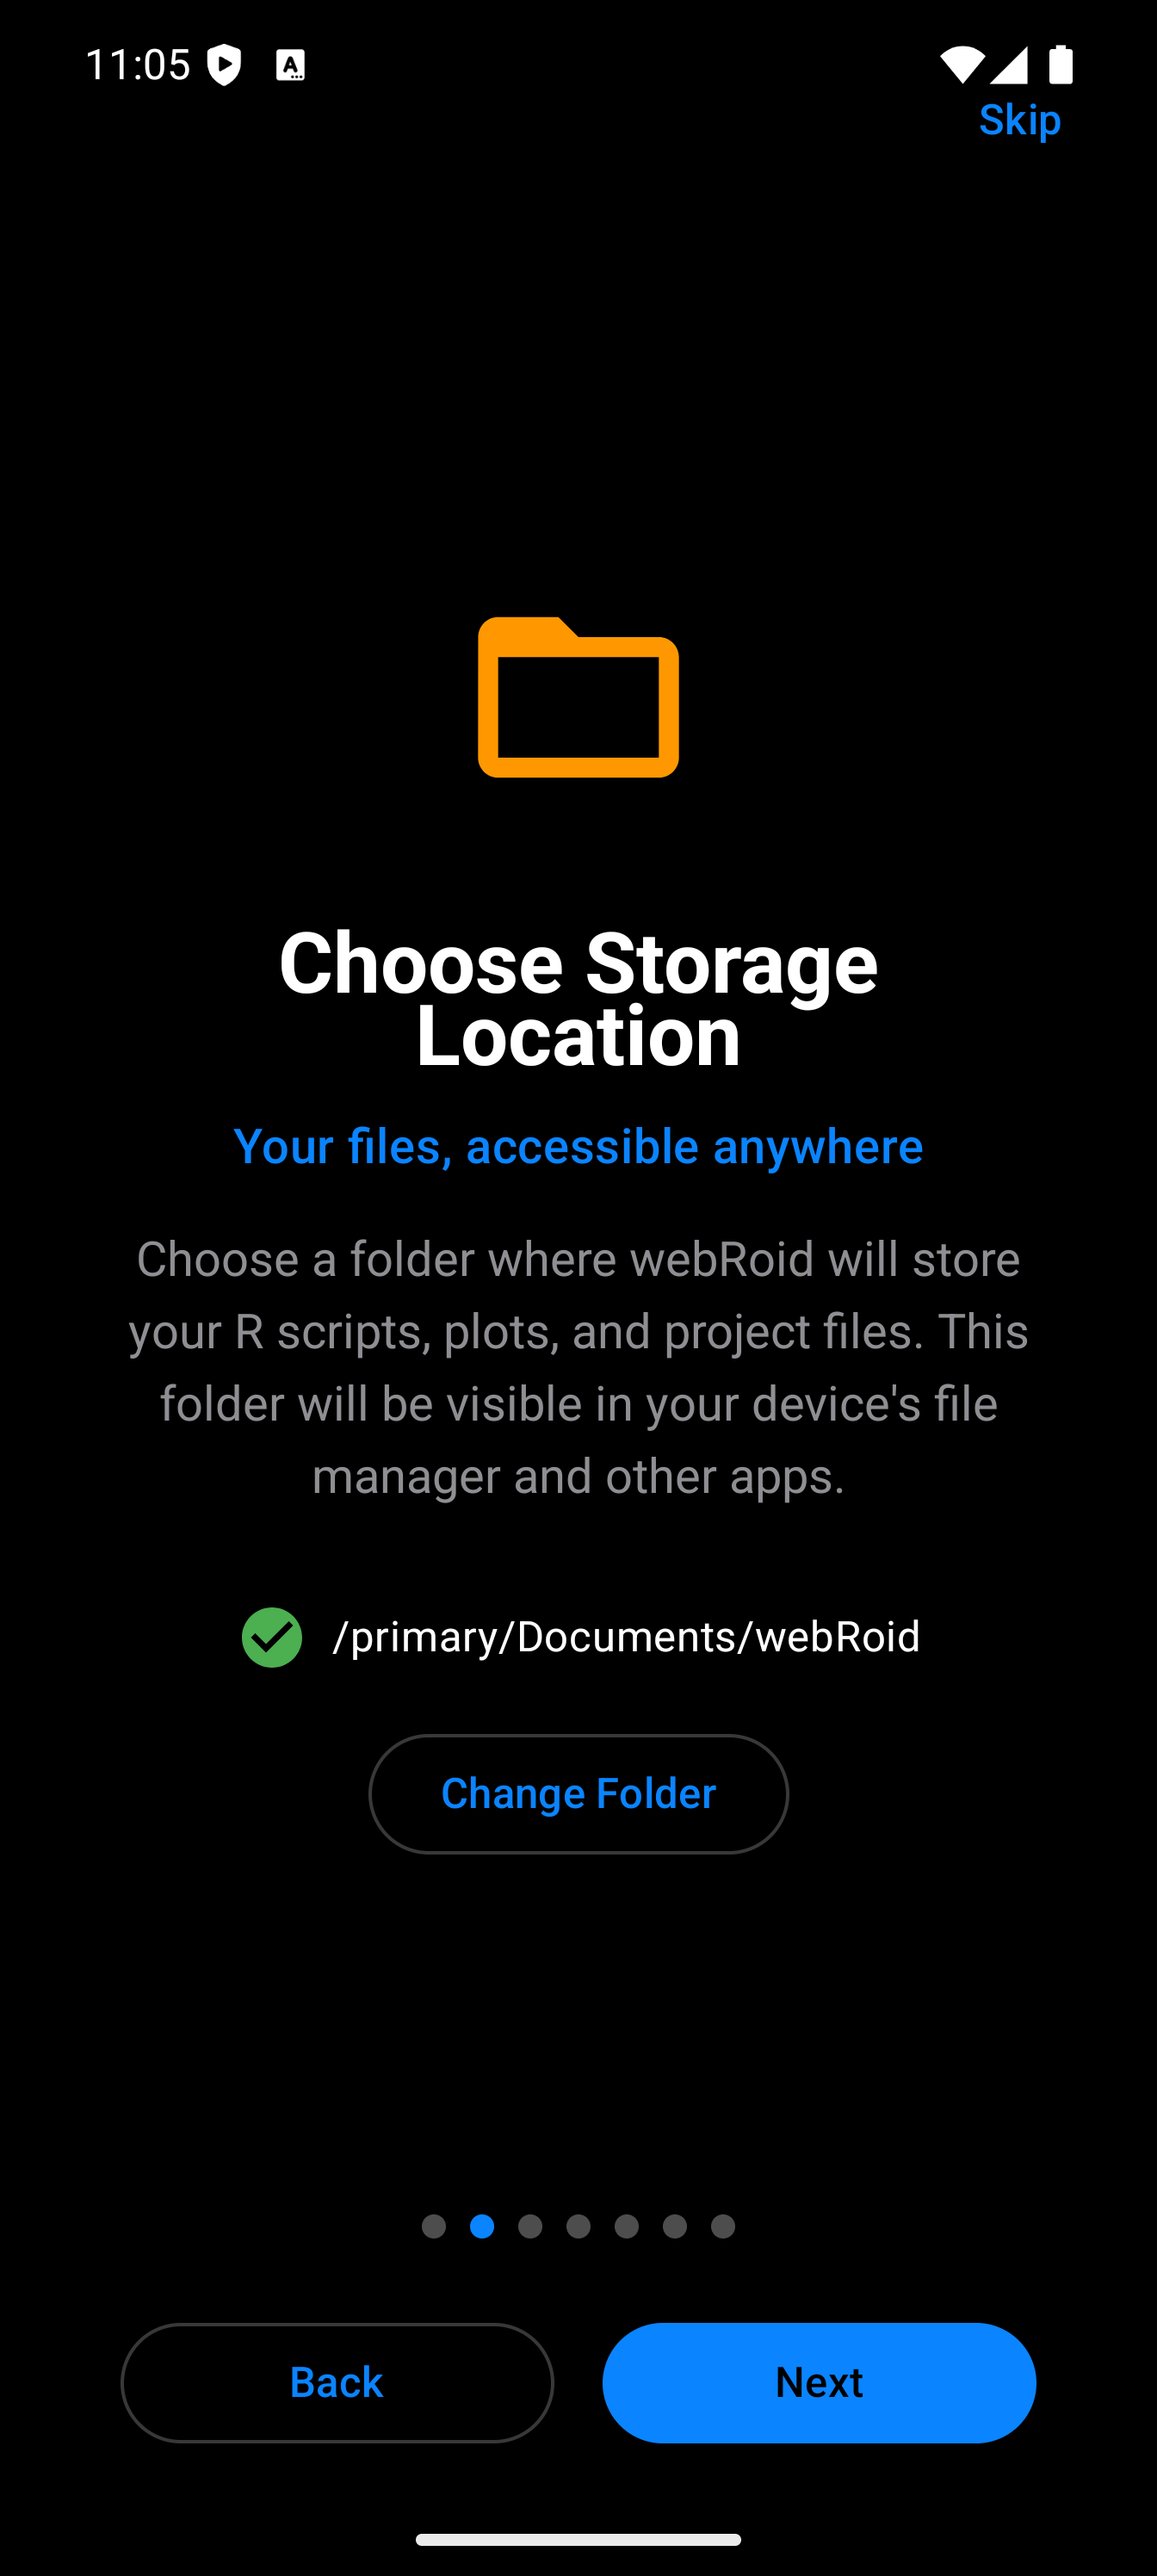
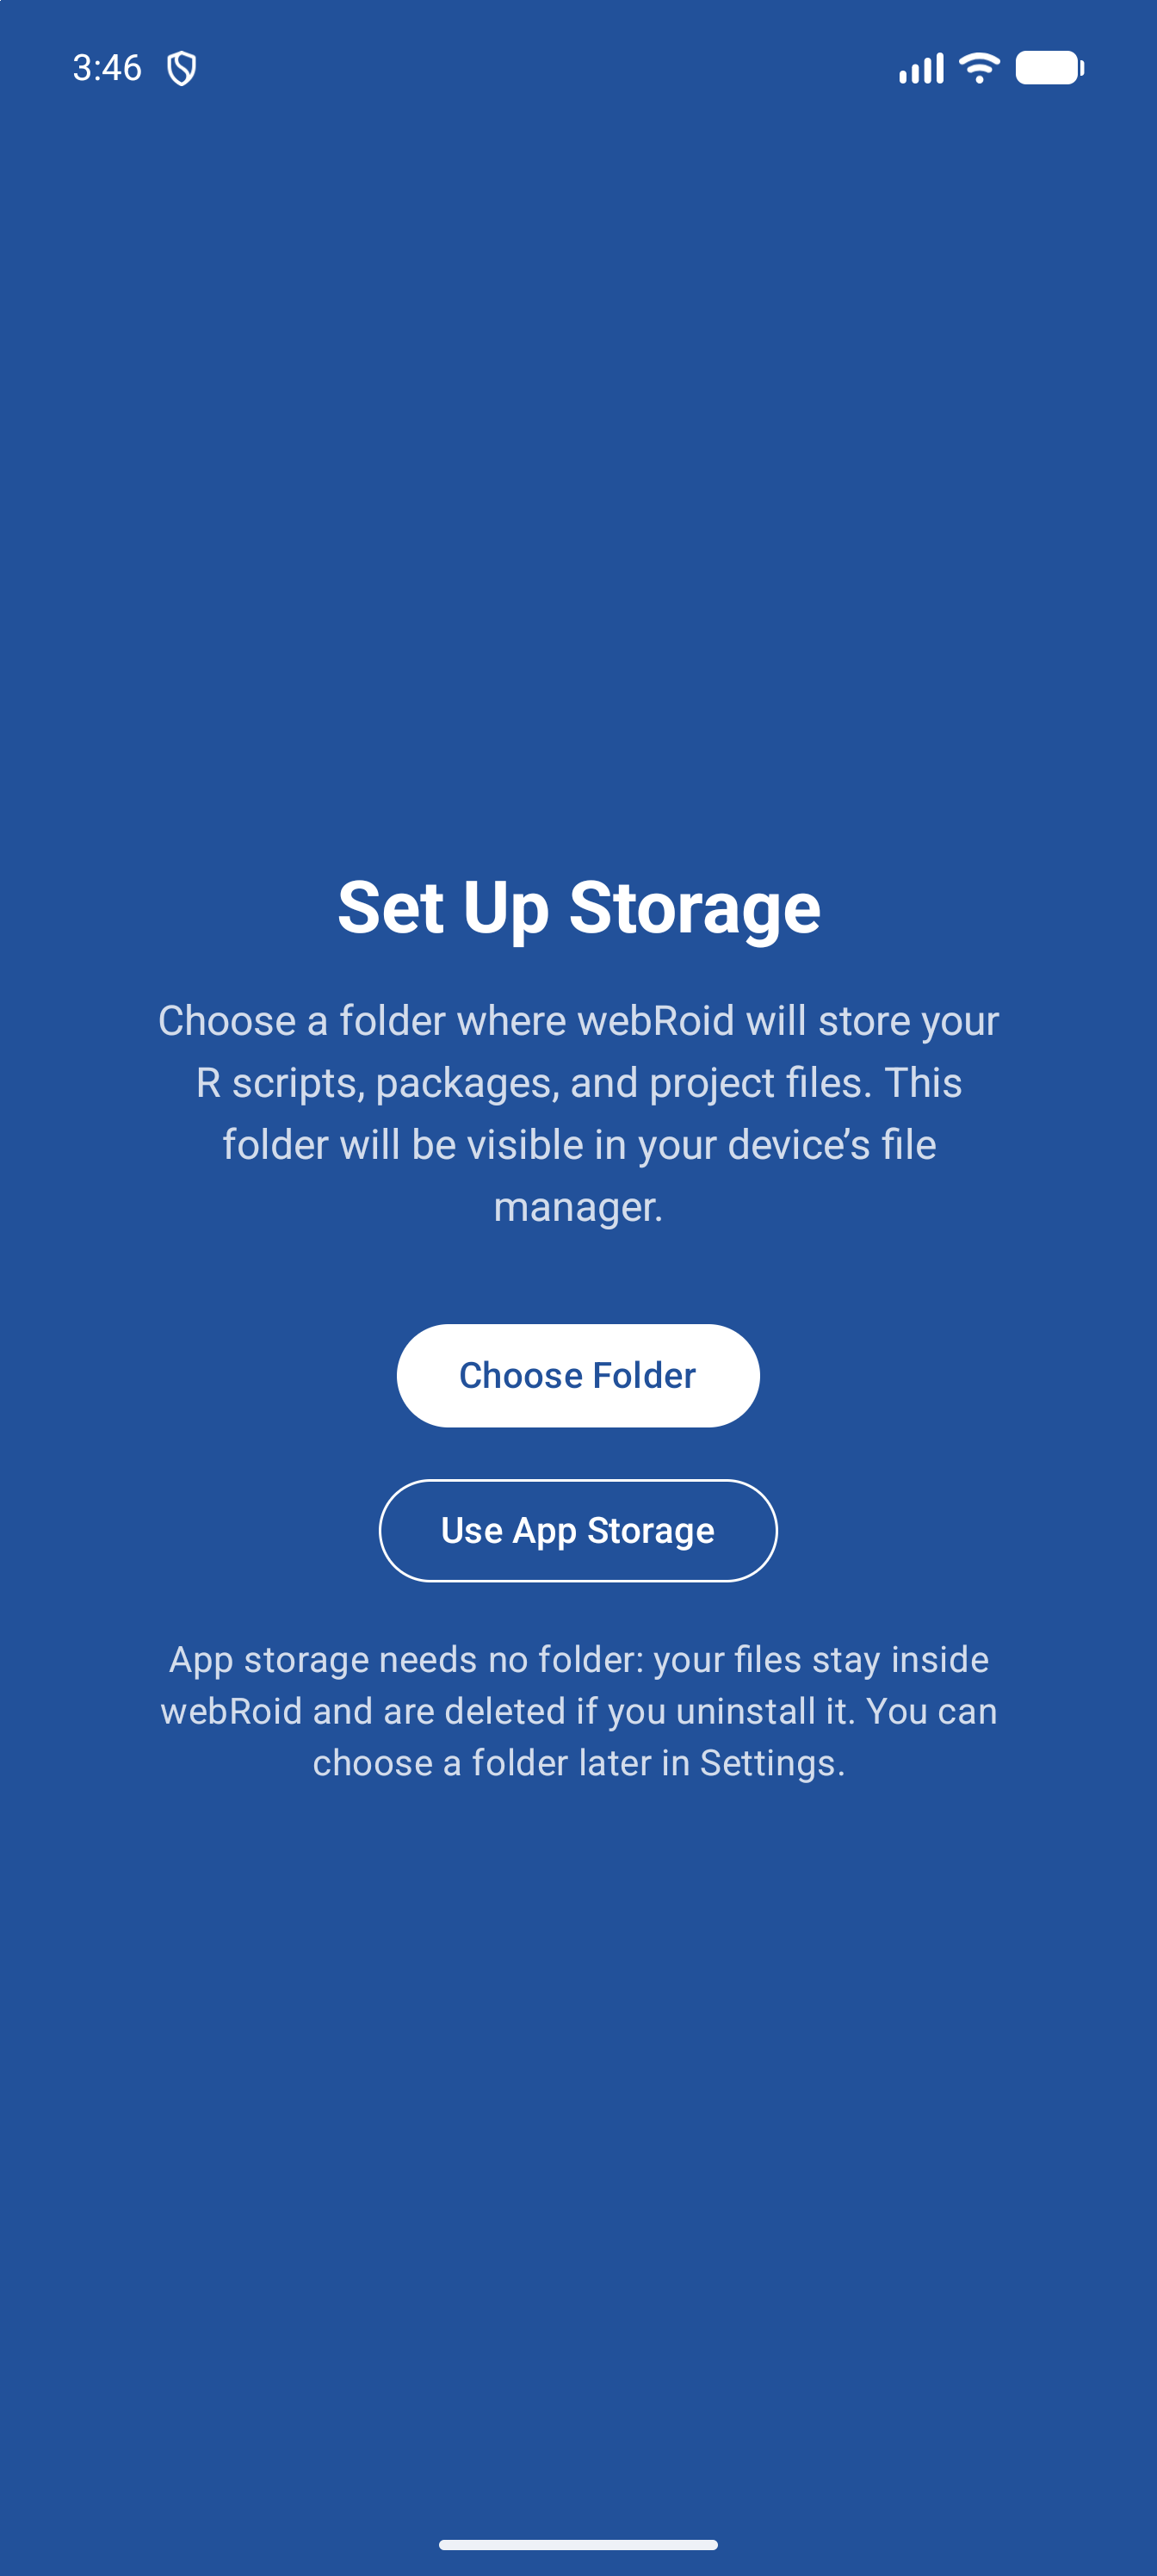
If you would rather not pick a folder, tap Use App Storage, just below Choose Folder. Your files are then kept in webRoid’s own folder, which needs no folder picker but is deleted if you uninstall webRoid; the page says so under the button. It shows up as webRoid in the system Files app, which is how you copy files out of it. You can choose a folder later in Settings > Storage Location.
Next stays greyed out until you have done one or the other, so this is the one page you cannot skip past.
You can pick any folder on your device or external storage. If you are unsure, the suggested Documents/webRoid works fine. You can always move files later using the Files tab or Android’s file manager, or change the folder in Settings > Storage Location.
Skip, at the top right, jumps to the end of the introduction. It does not skip the folder: without one, the app shows Set Up Storage before you can work, with the same Choose Folder and Use App Storage buttons.
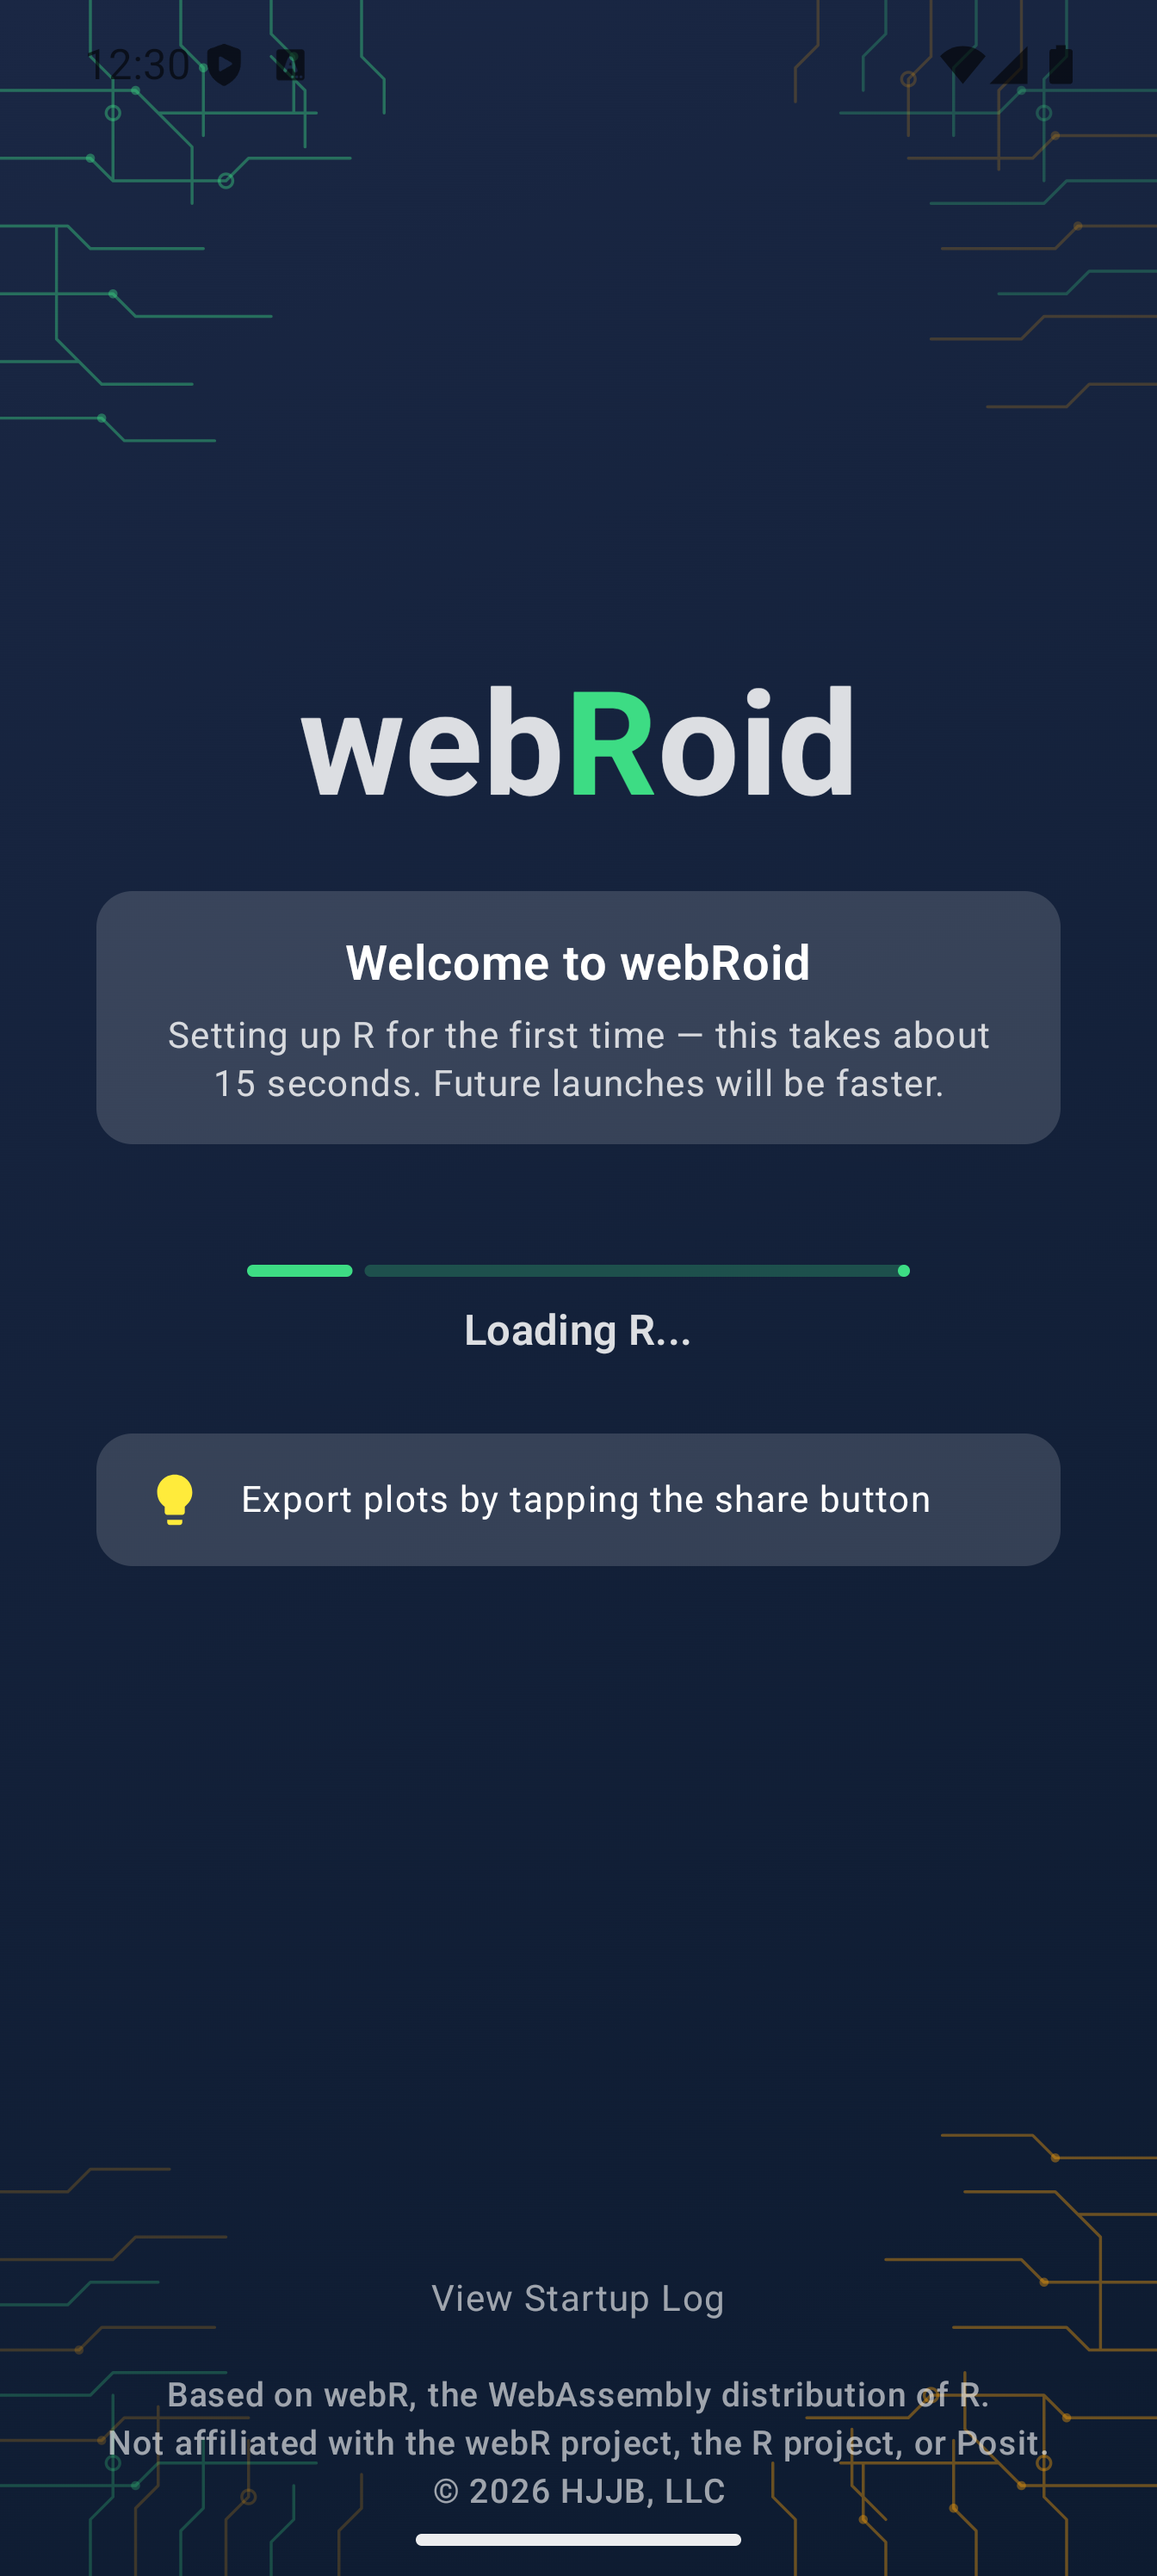
After onboarding completes, the R runtime initializes. A loading screen shows a progress bar and the current initialization phase (preparing, starting the server, loading R, and restoring any packages you have installed), with a tip below it that changes every few seconds. On first launch this takes about 15 seconds while WebAssembly modules load; subsequent launches are faster. The loading screen is dark whichever theme you use.
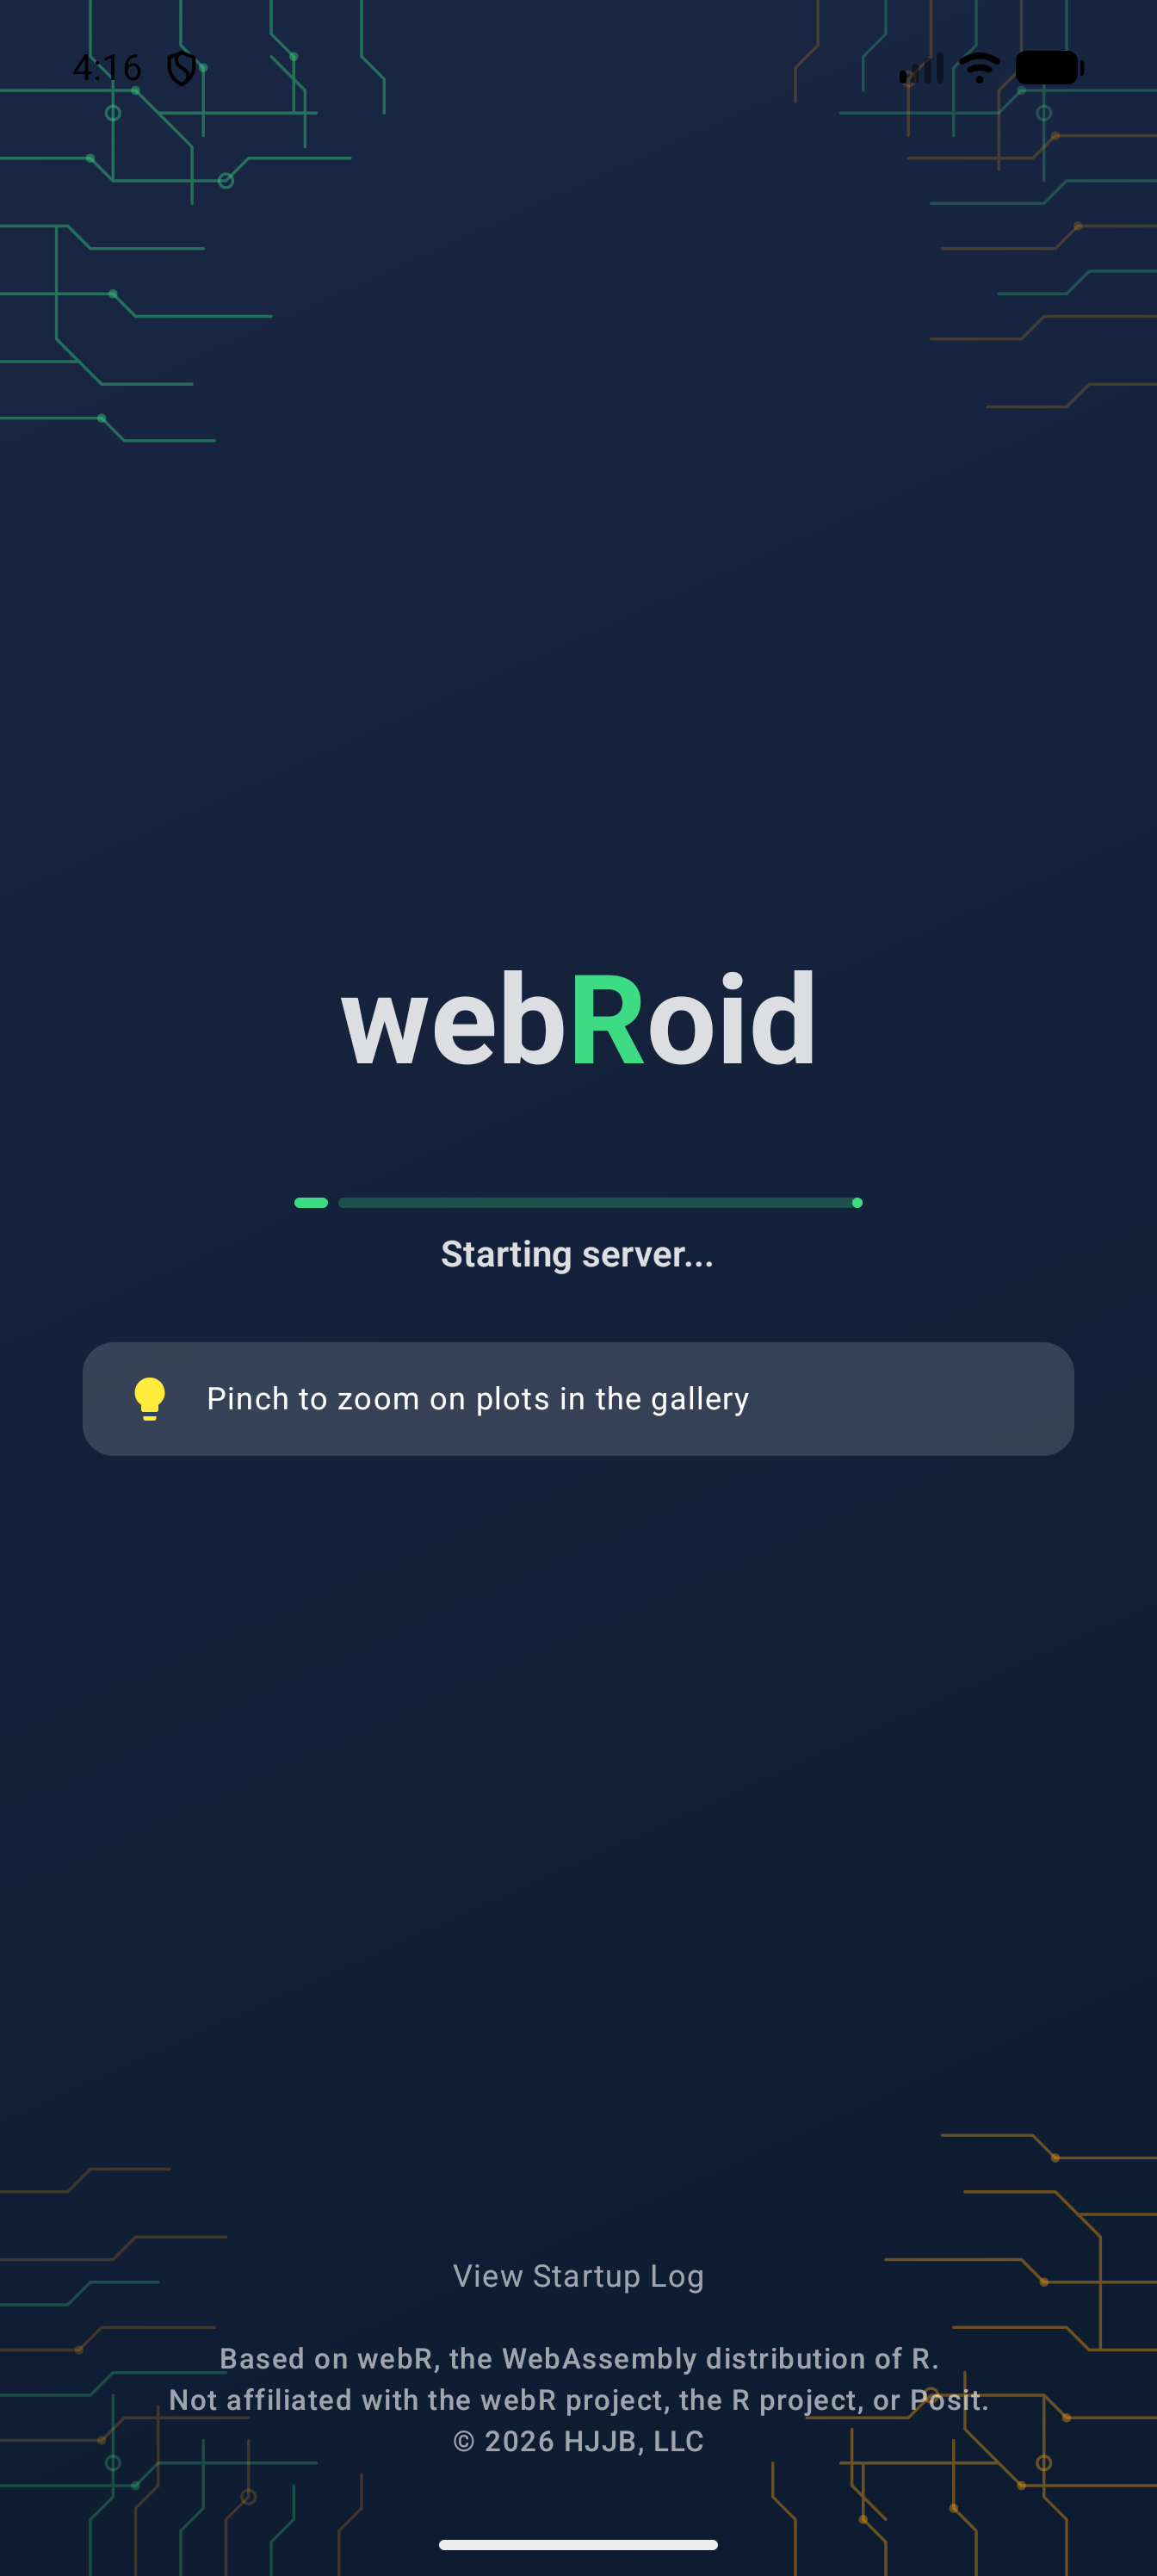
On later launches you see the same screen without the welcome card:
The App Layout
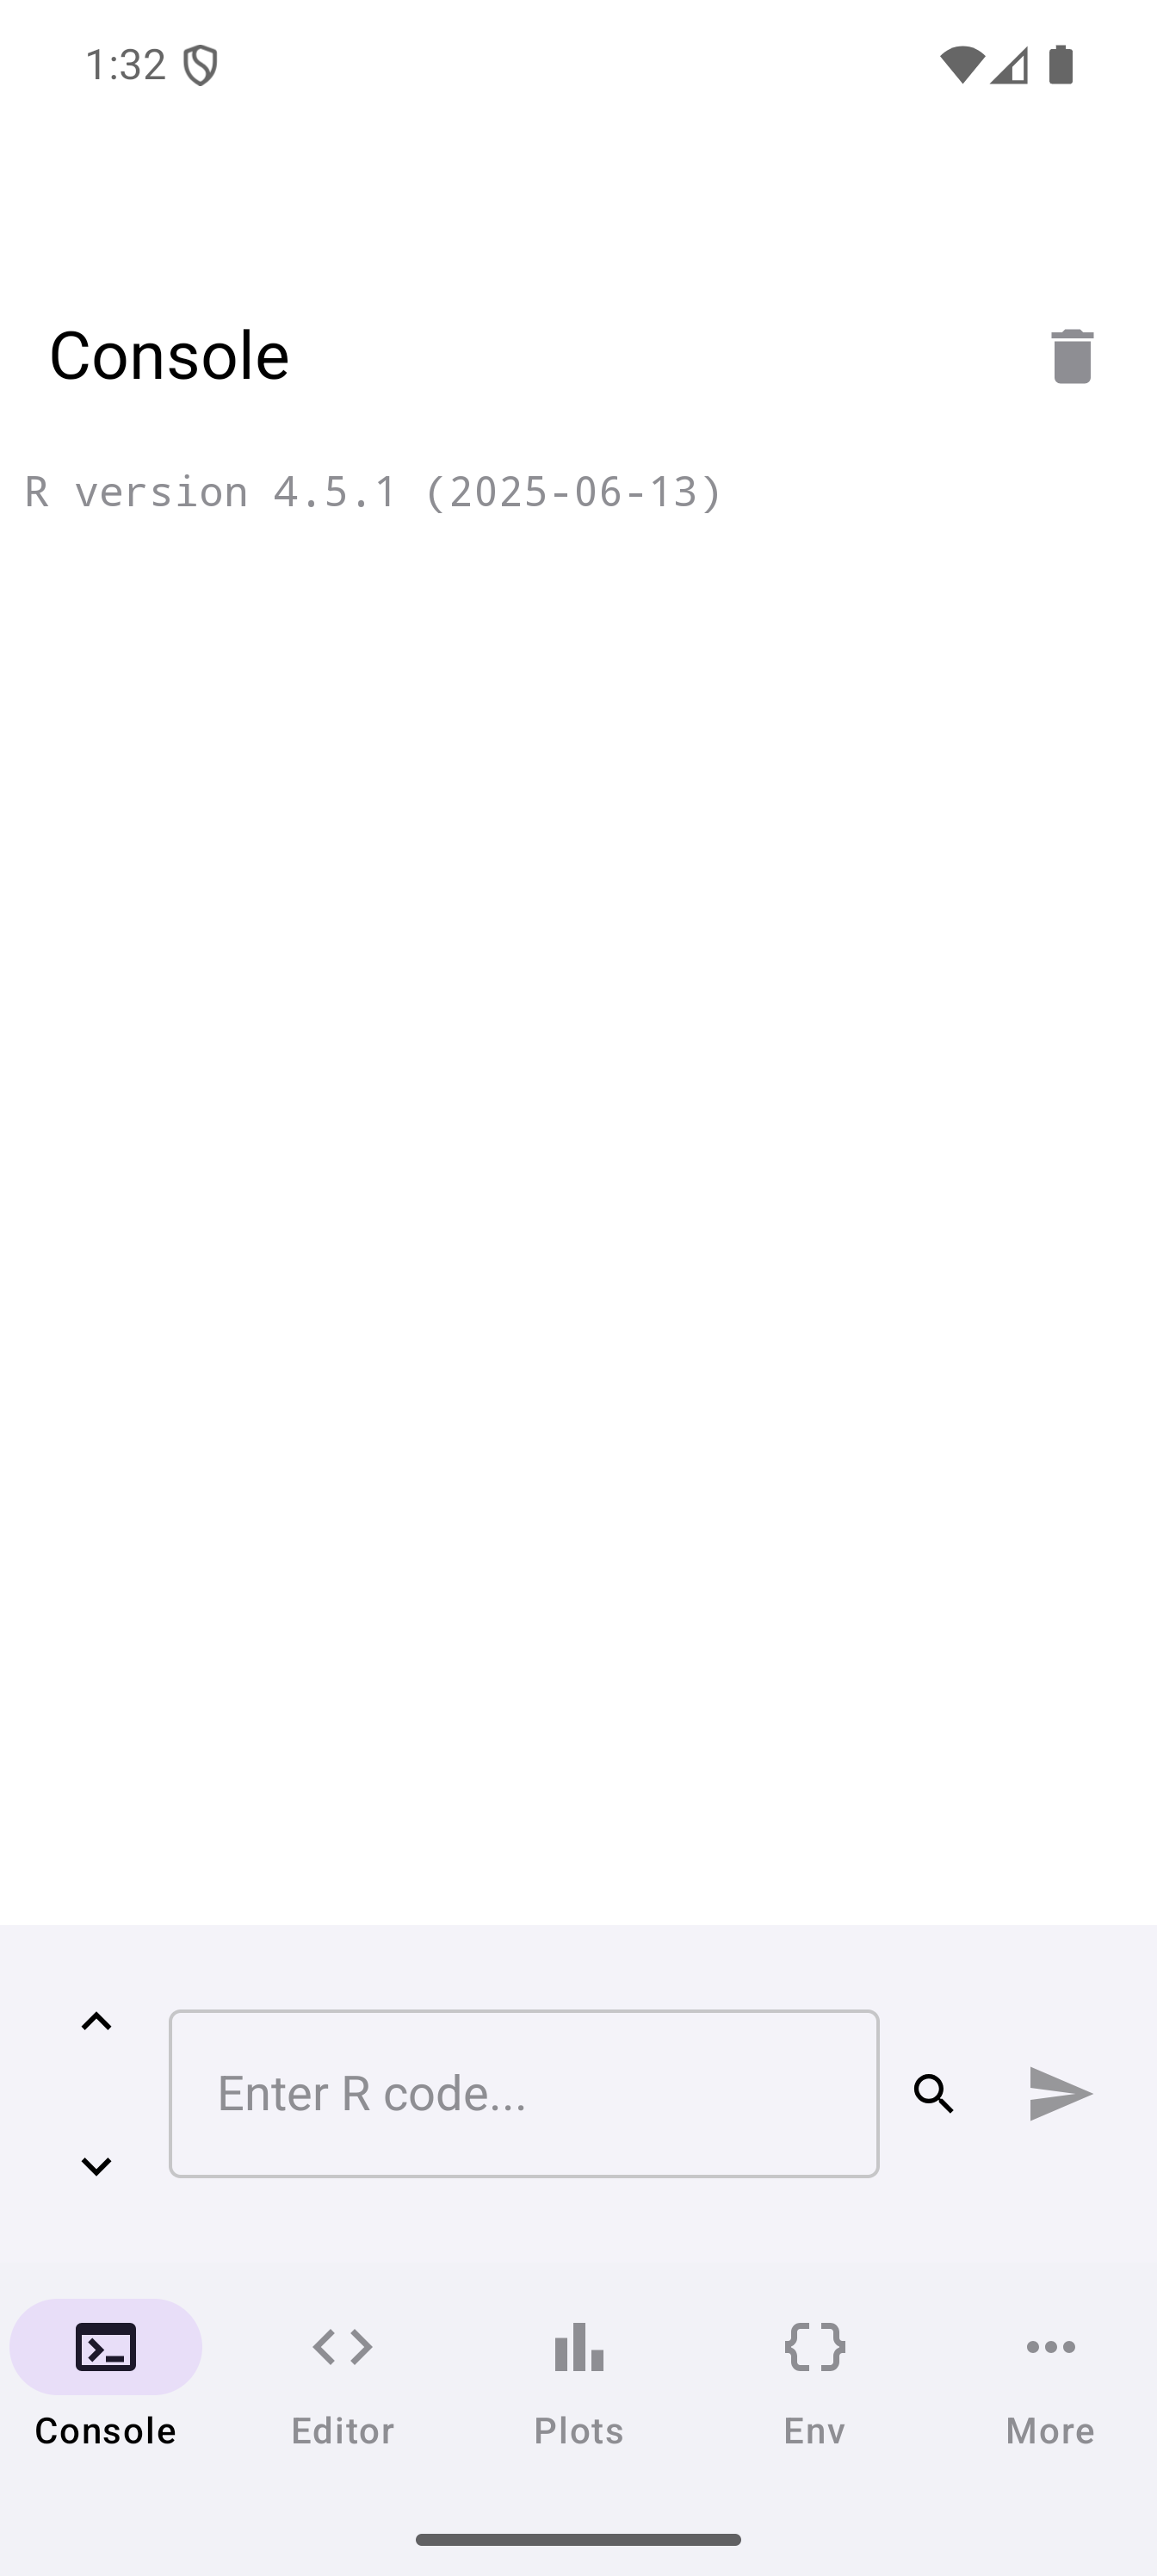
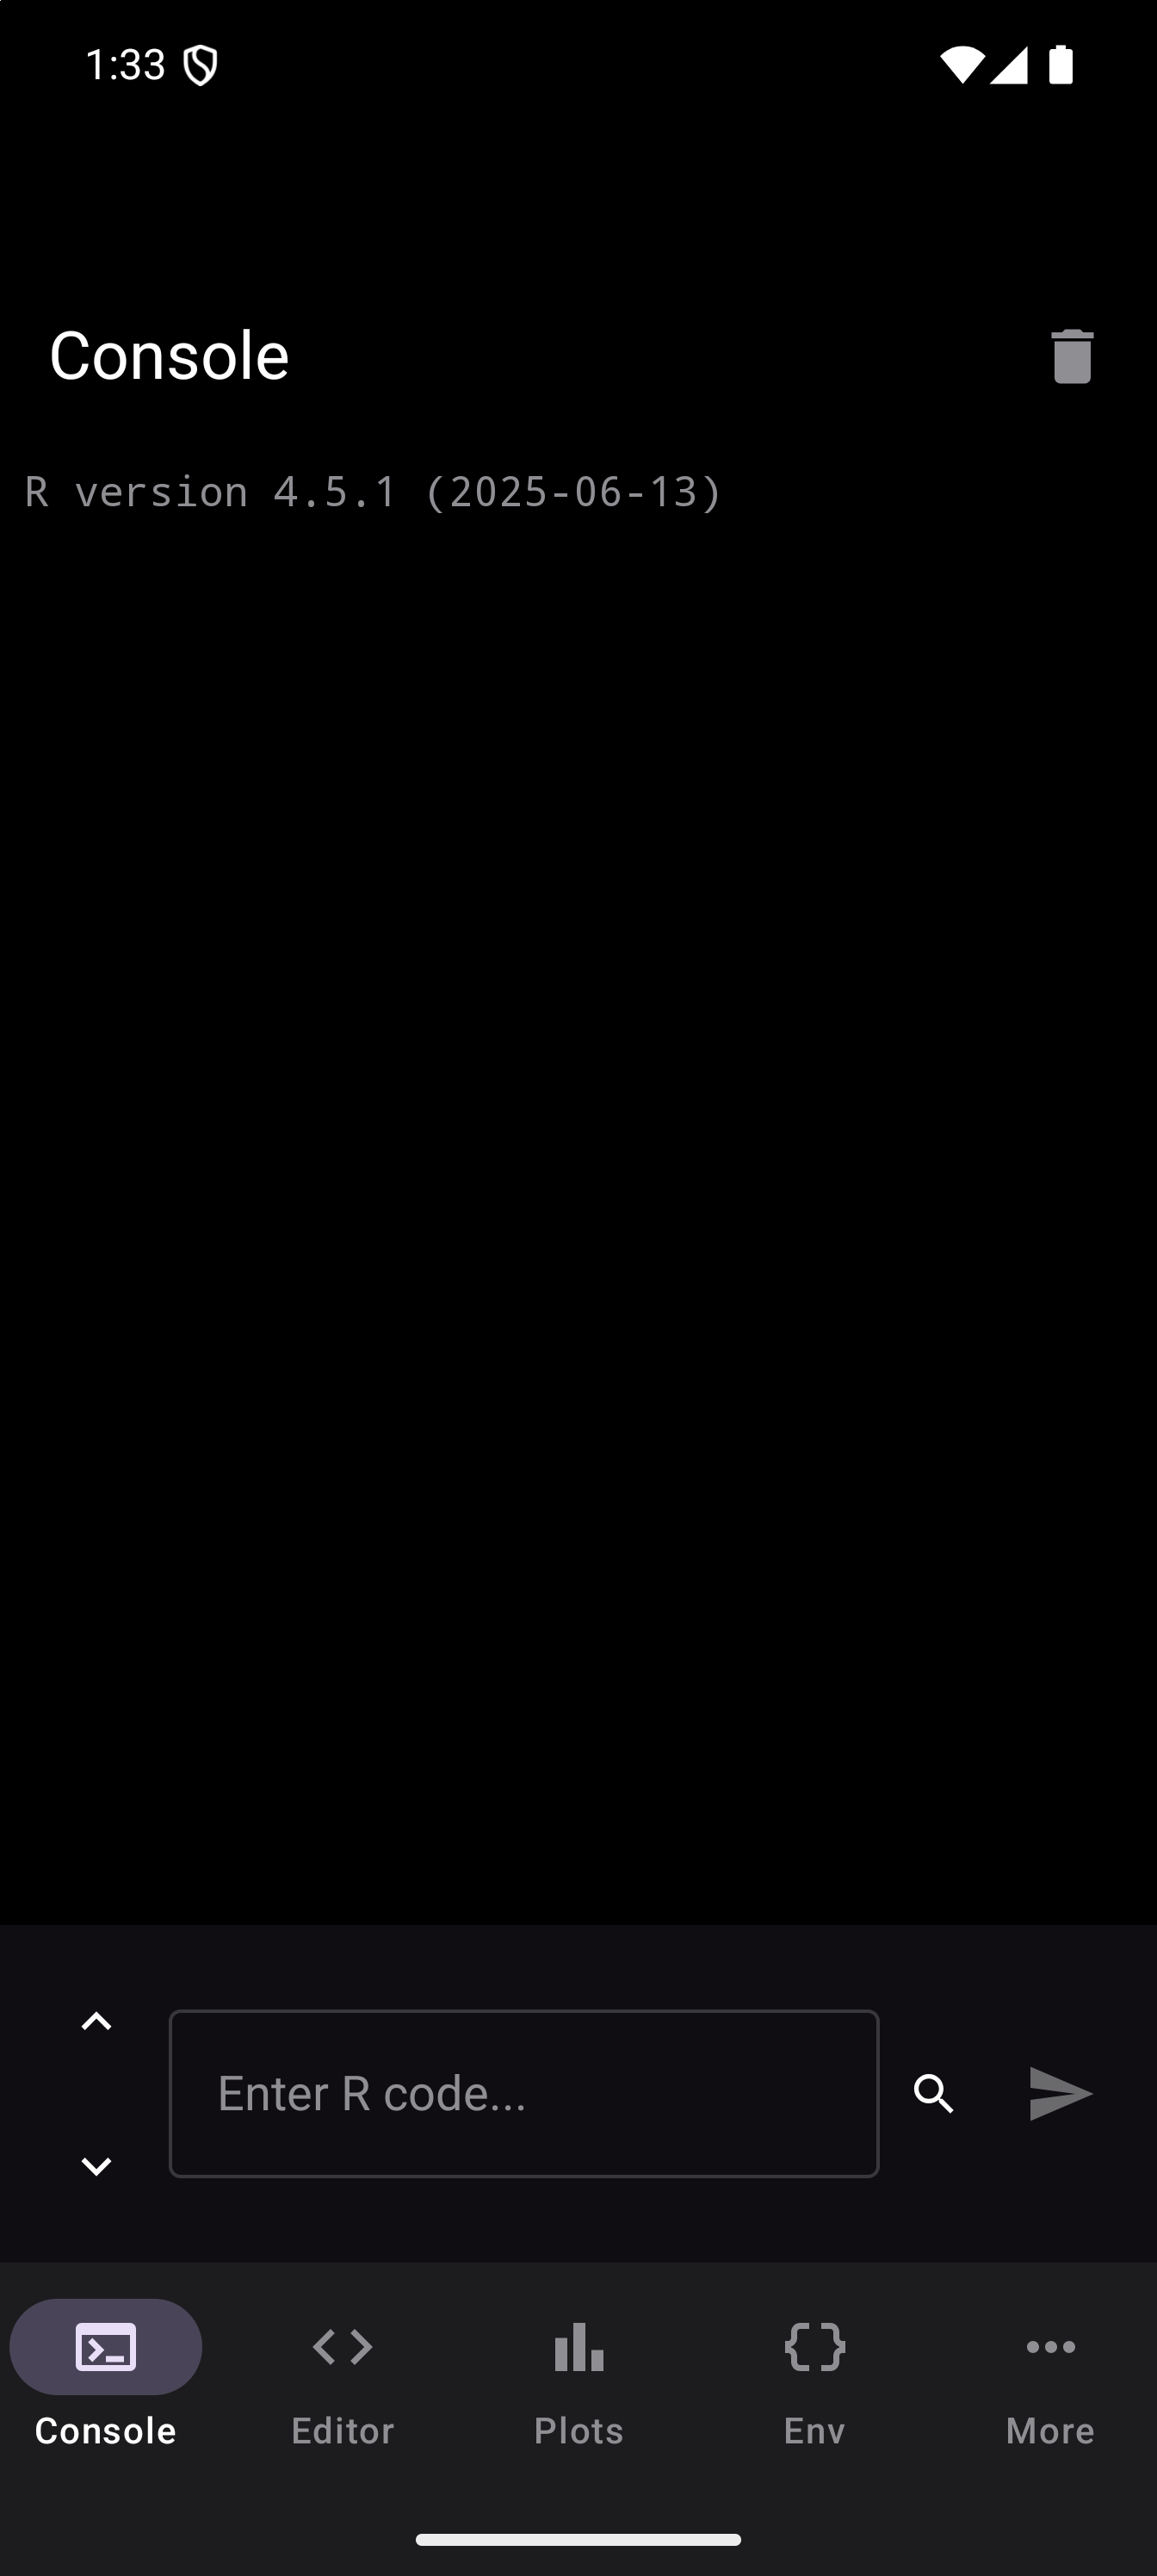
On a phone, webRoid uses a bottom navigation bar with five buttons:
| Button | Purpose |
|---|---|
| Console | Interactive R REPL. Type and run R code |
| Editor | Multi-tab script editor with syntax highlighting |
| Plots | Gallery of generated R graphics |
| Env | Inspect variables, data frames, and functions in your workspace |
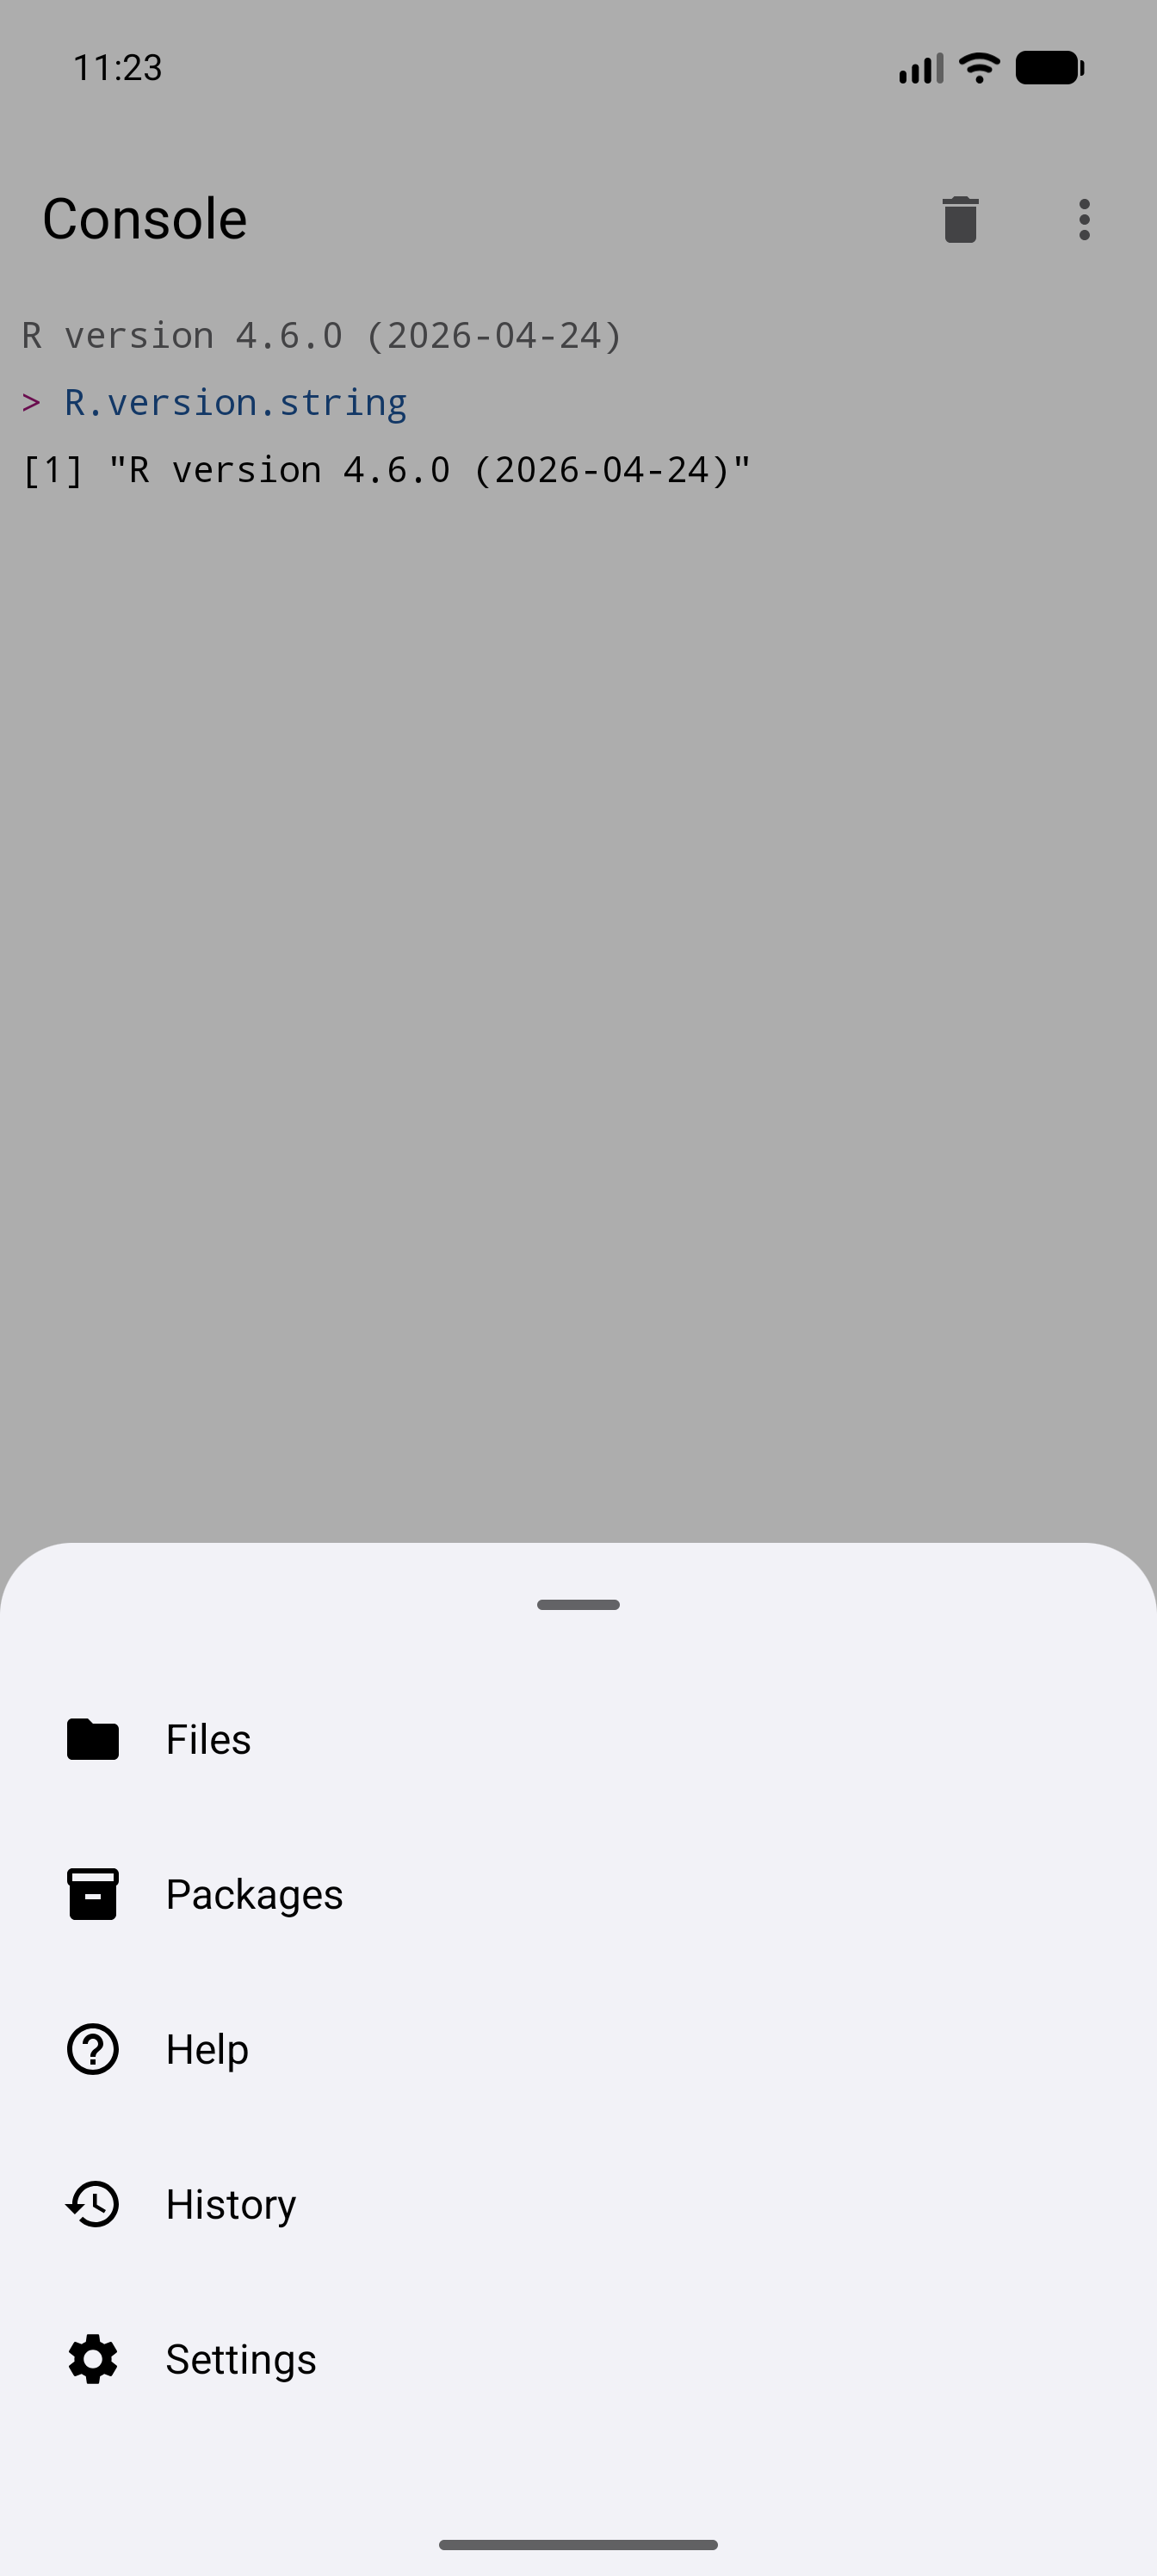
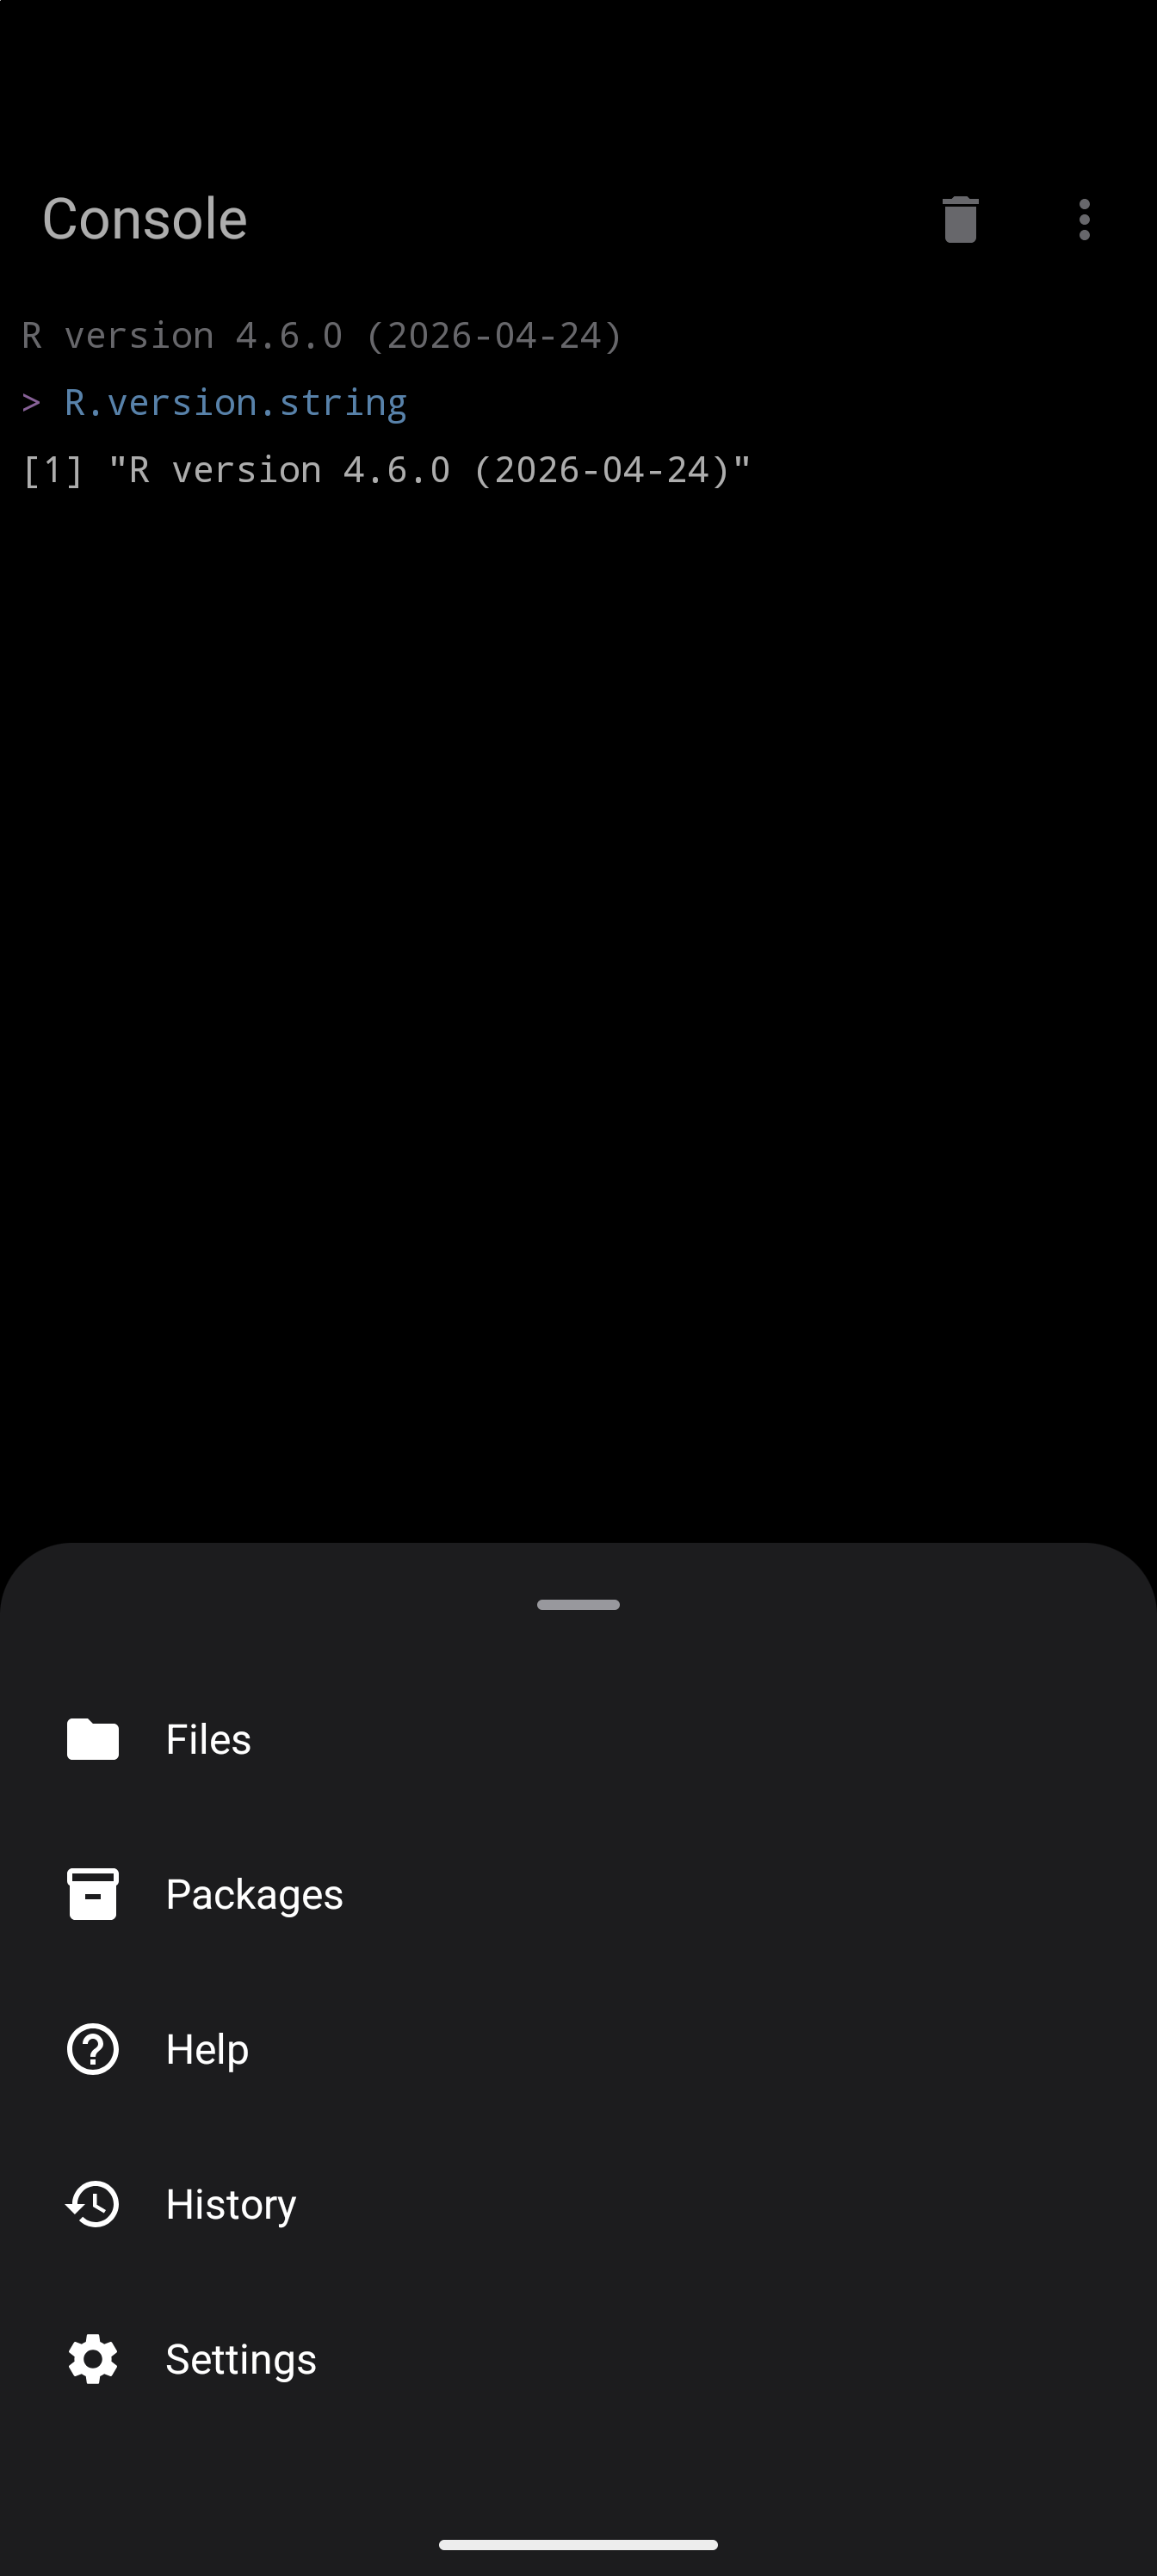
| More | Opens a sheet with the remaining sections |
Four of those are screens; the fifth, More, opens a sheet listing Files, Packages, Help, History, and Settings. Those five are not tabs of their own, so tap More to reach them.
On a tablet or Chromebook, a new install starts in the Workspace layout instead, with the Console, Editor, Environment and Plots on screen at once. You can change the layout in Settings at any time. More on that below.
Your First R Session
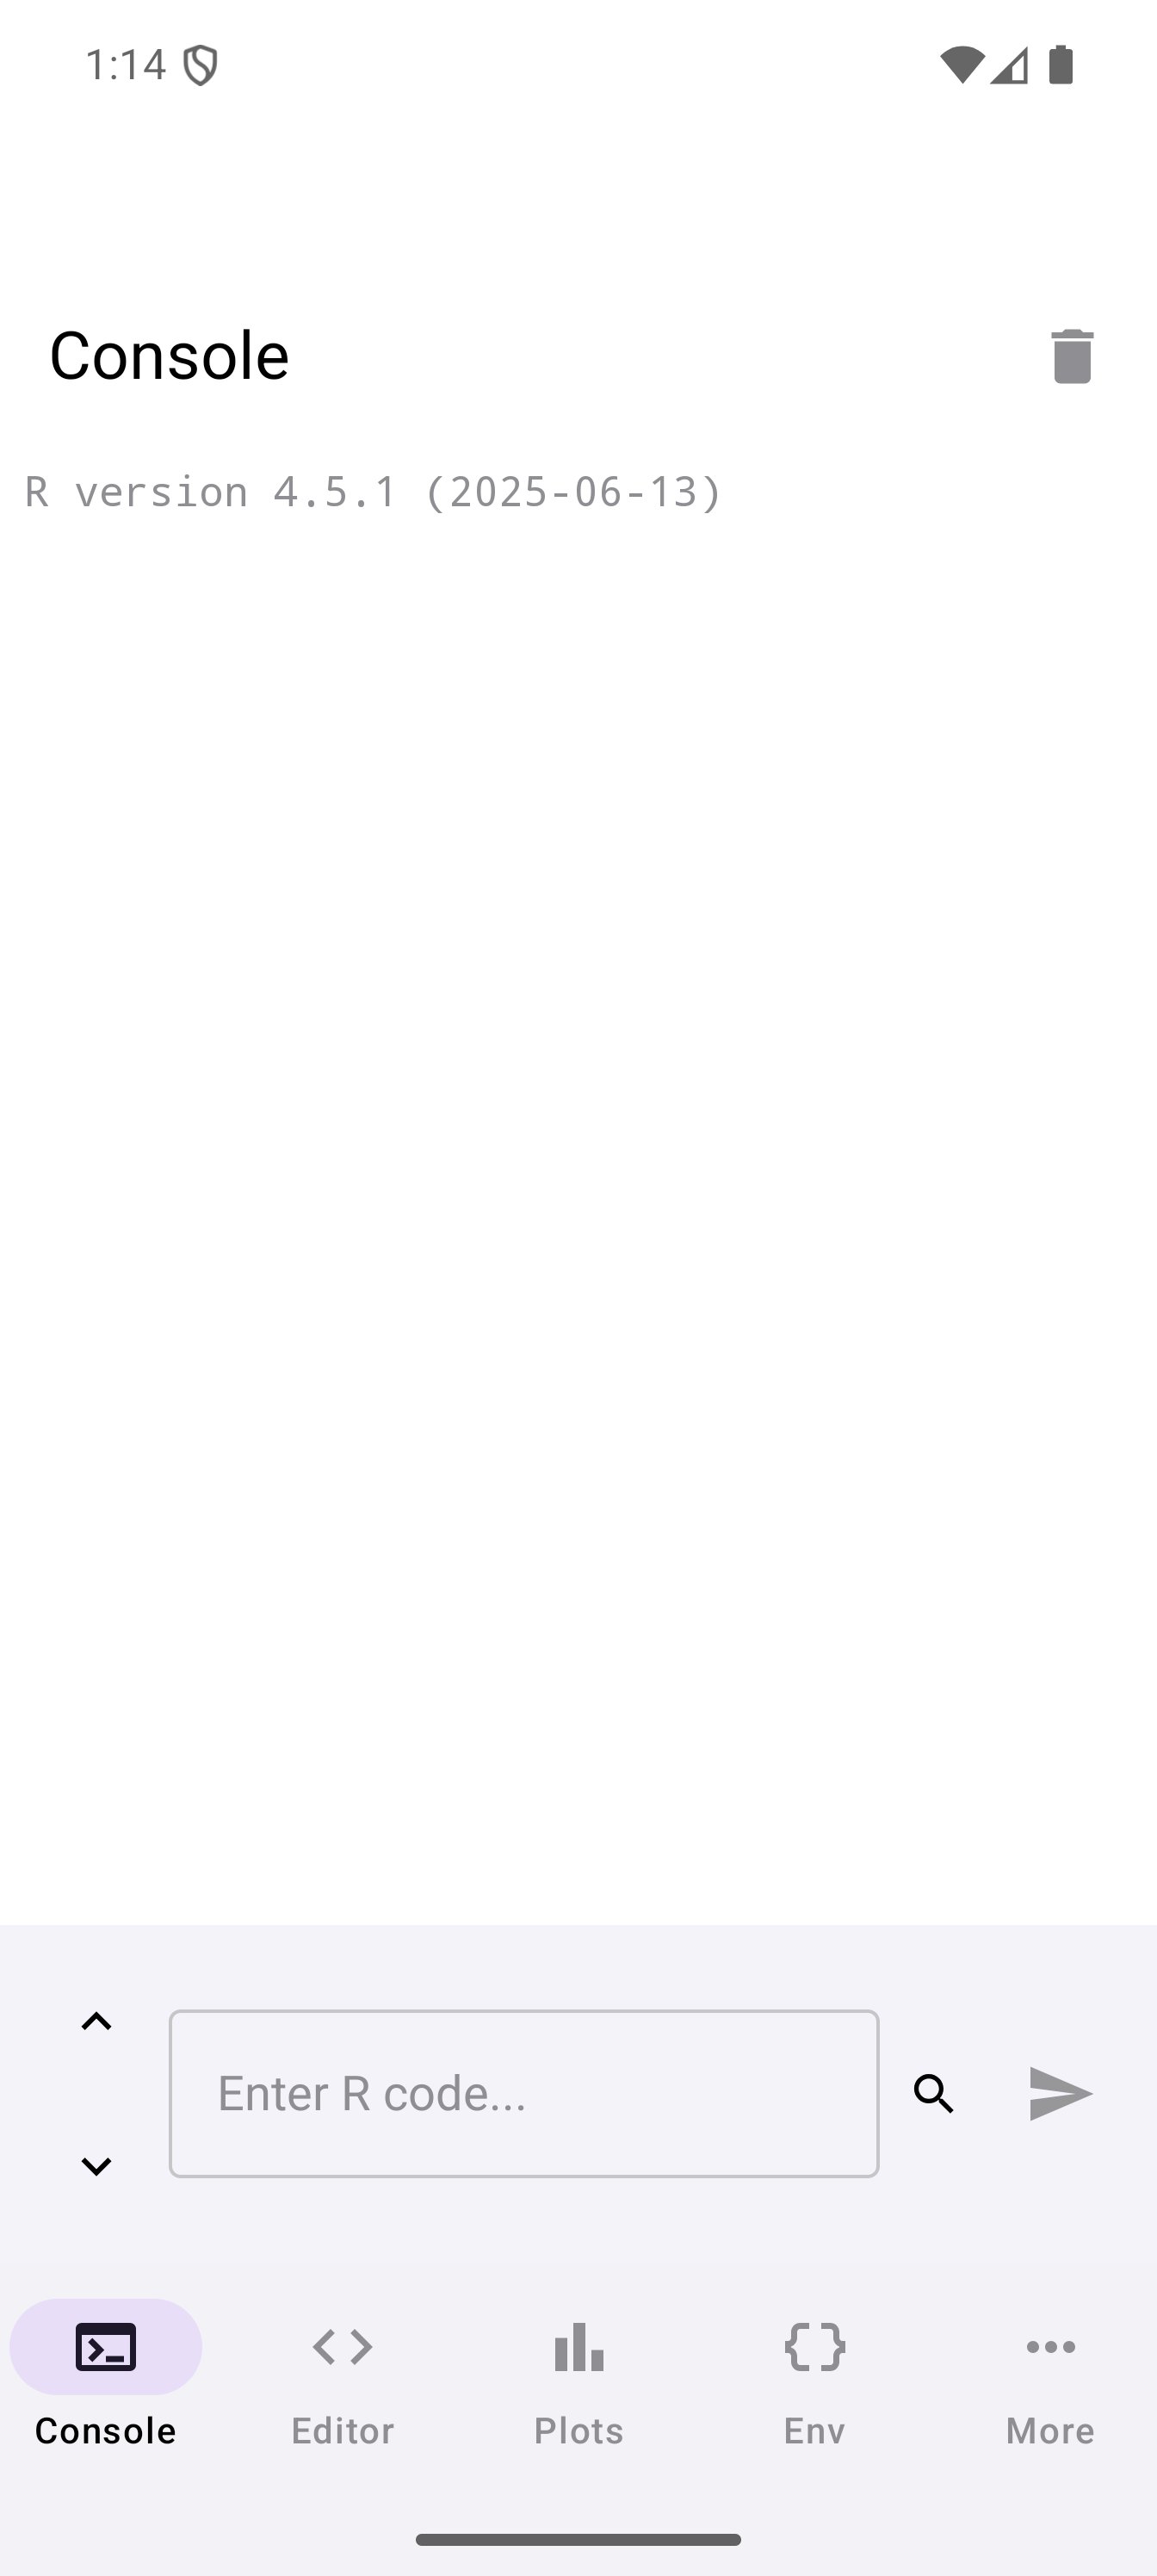
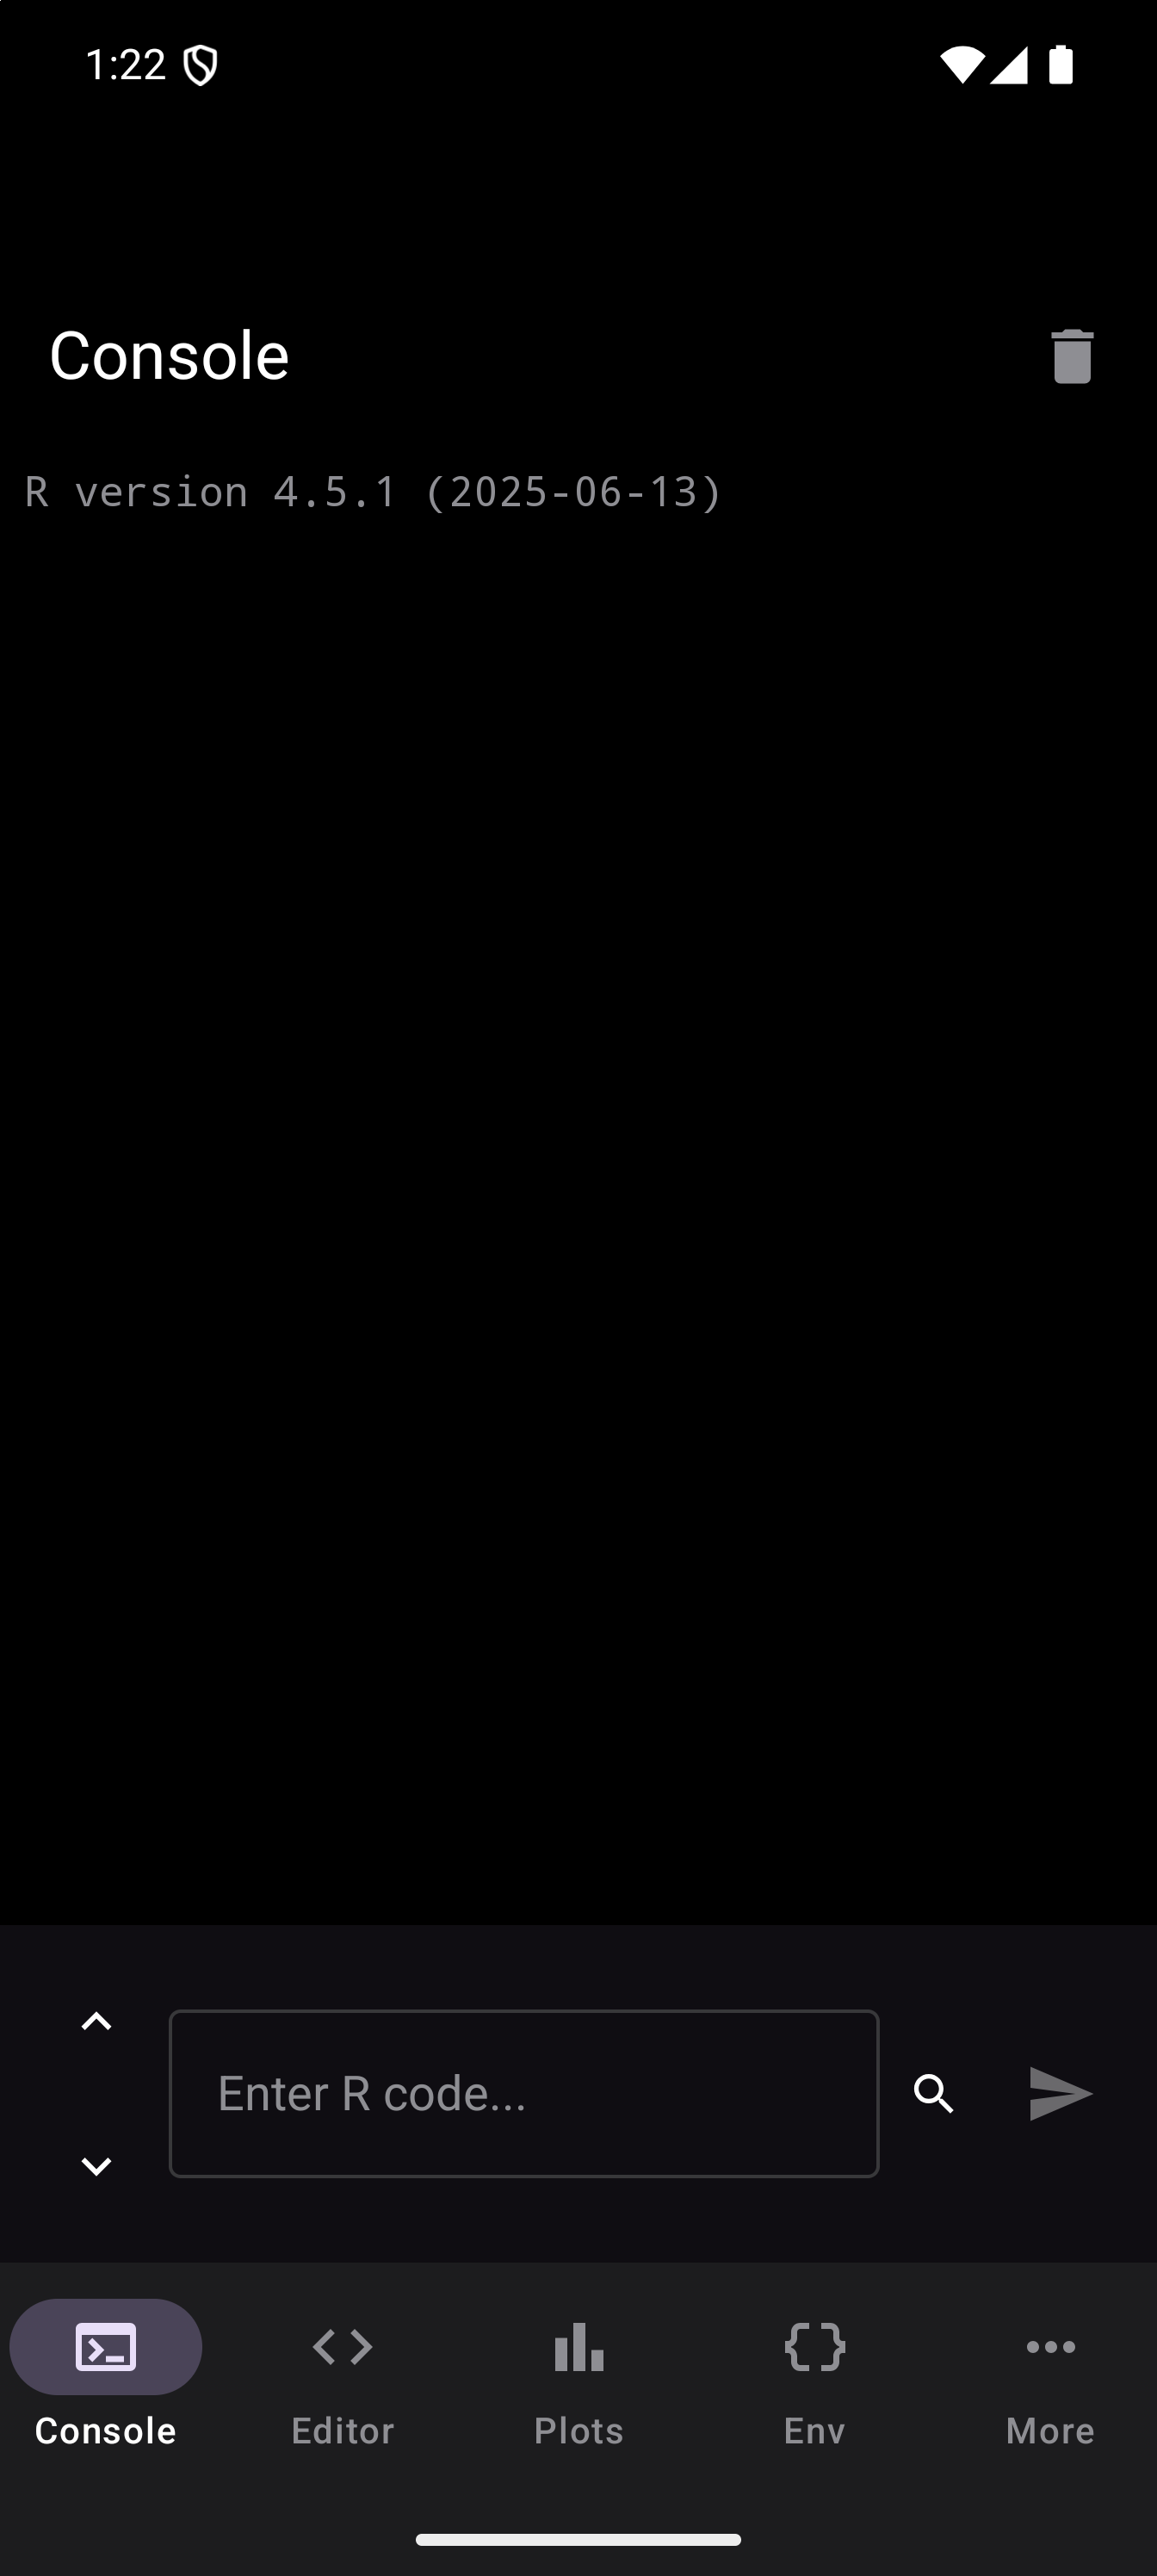
After the runtime loads, you land on the Console tab (in the Workspace, the Console pane). With a hardware keyboard attached, its input already has focus, so you can start typing. The screen is empty except for the R version line at the top, and an input field at the bottom with the placeholder text “Enter R code…” and the Run button, a send arrow, to its right.
Type a simple expression and tap Run (or press Enter on a hardware keyboard):
1 + 1You should see [1] 2 appear in the output area. Try a few more commands, one at a time, to see how different kinds of output look:
x <- c(10, 20, 30)
mean(x)
print("Hello from webRoid!")
warning("this is a warning")
stop("an error occurred!")
y
The last two commands end in an error on purpose, so you can see what an error looks like. y fails because nothing called y exists yet.
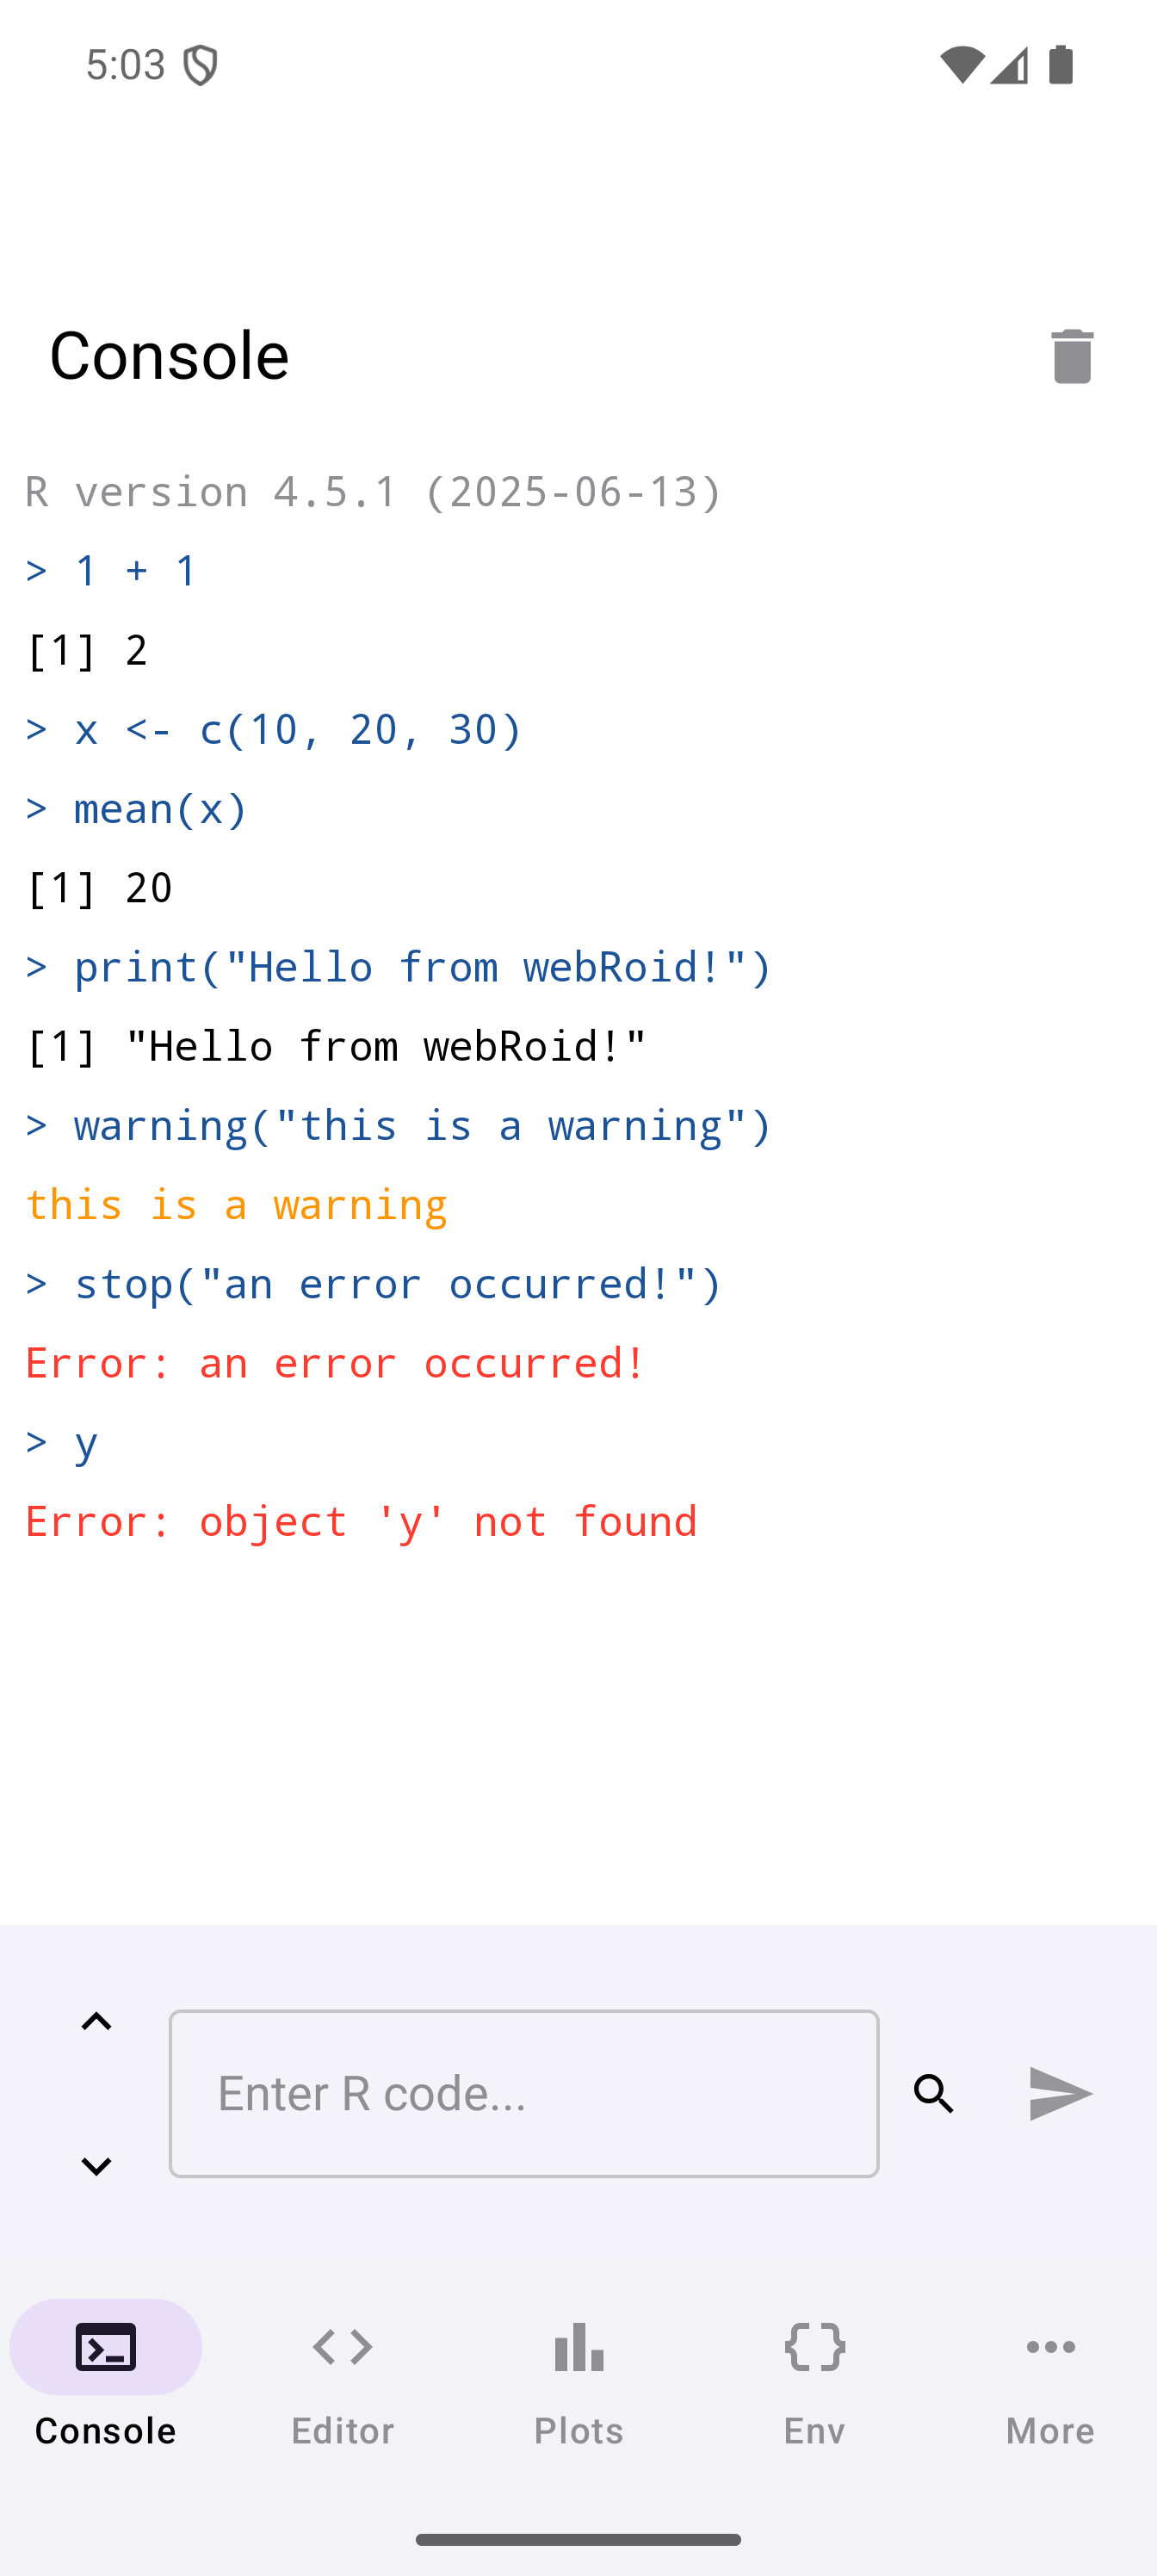
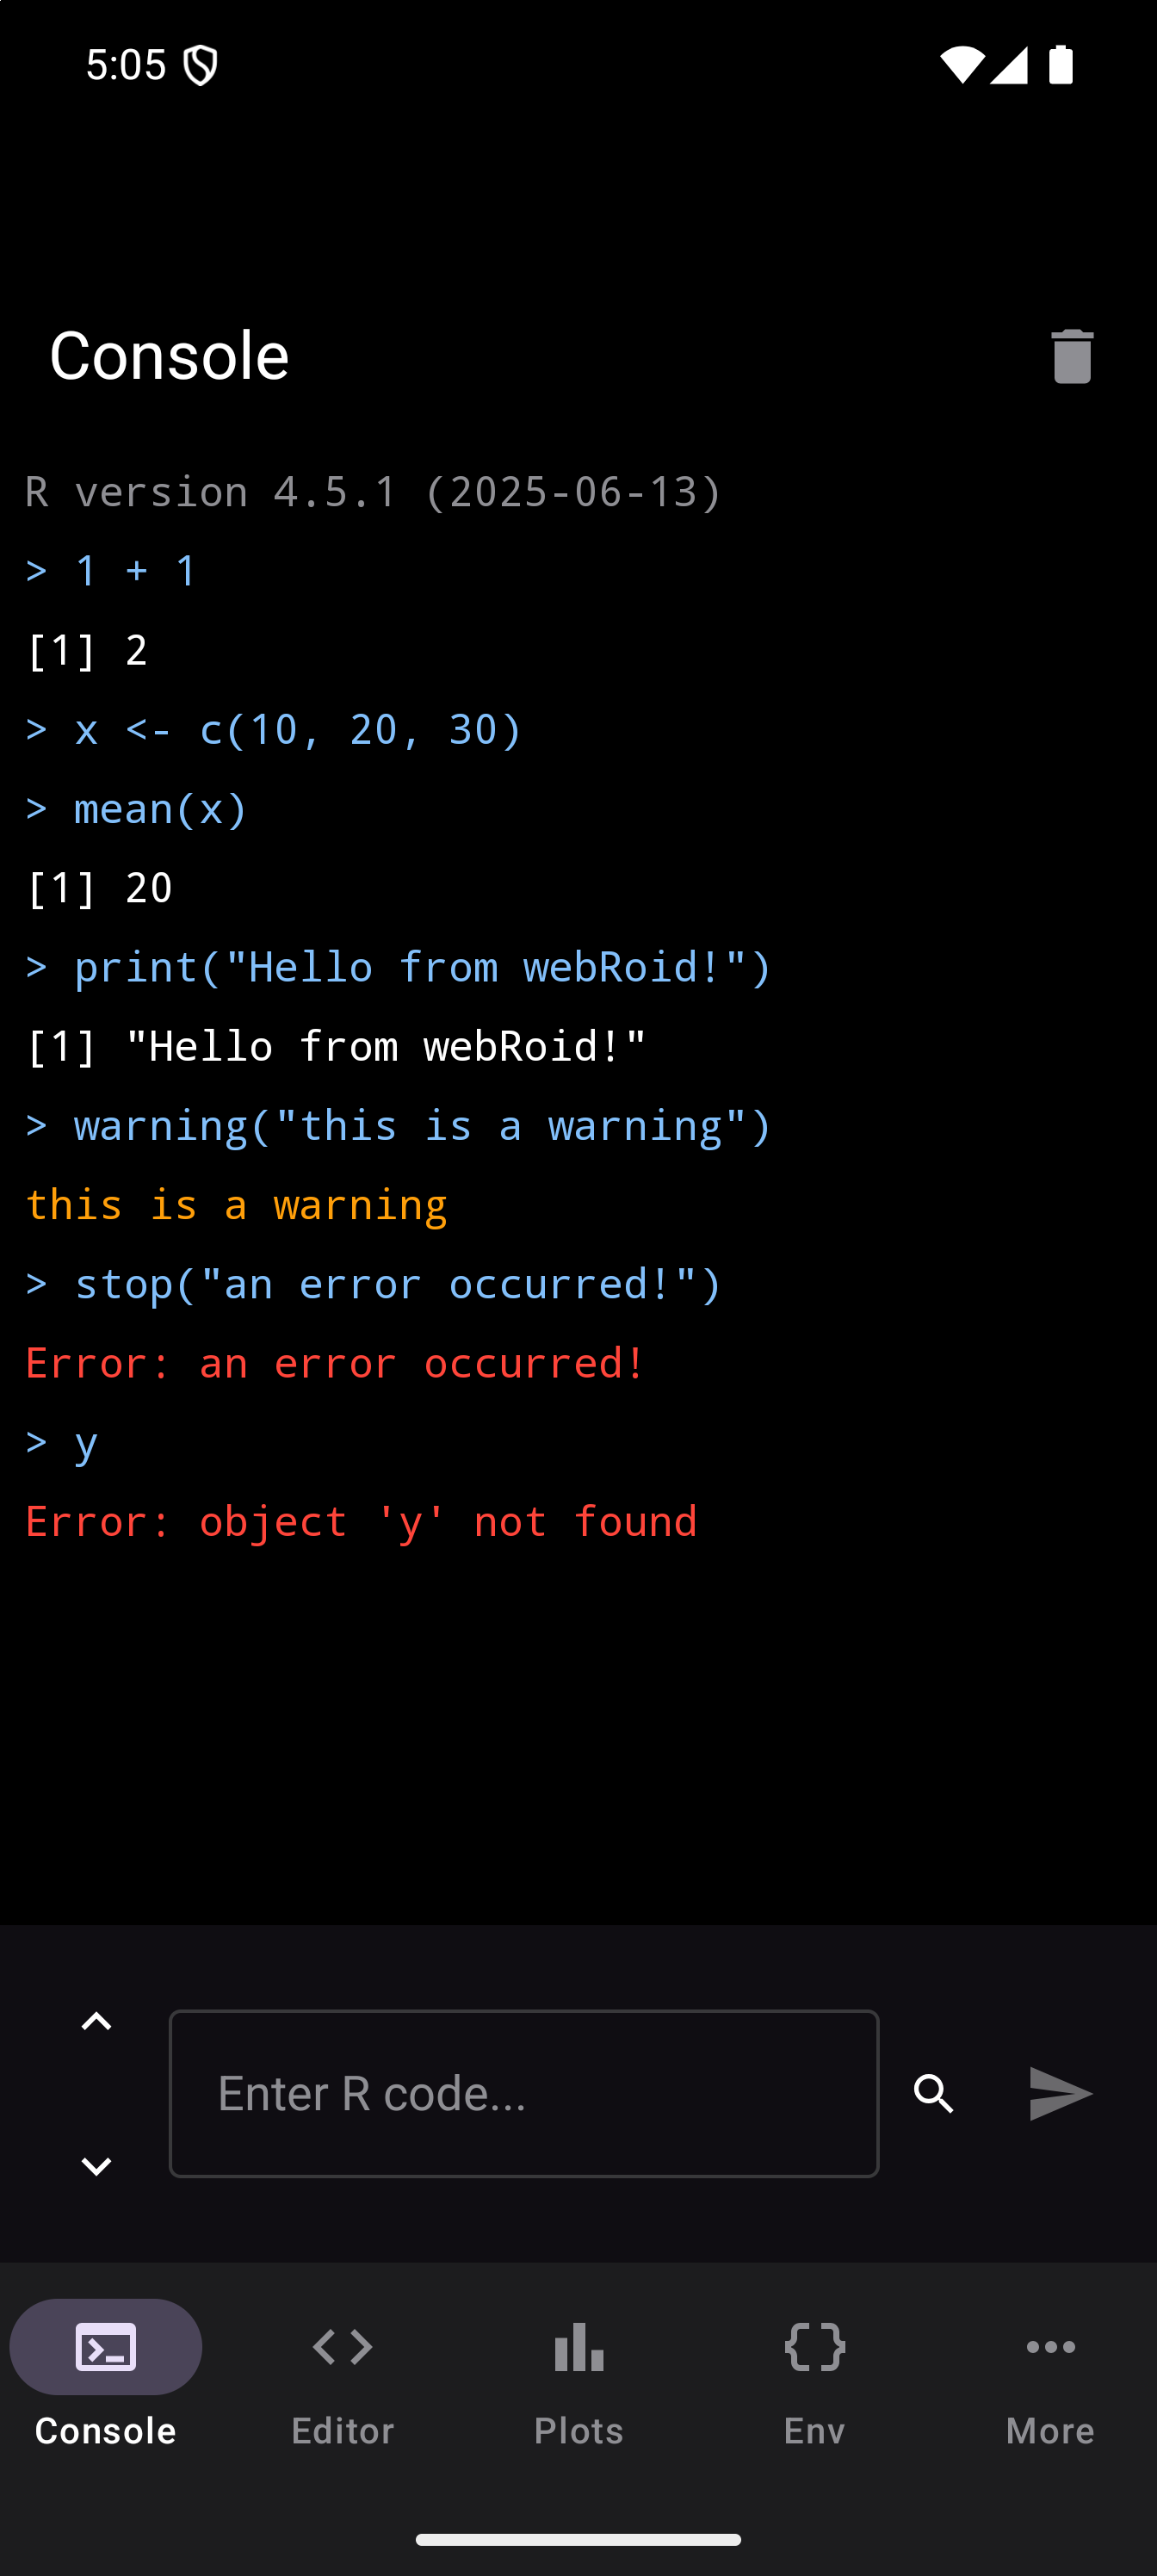
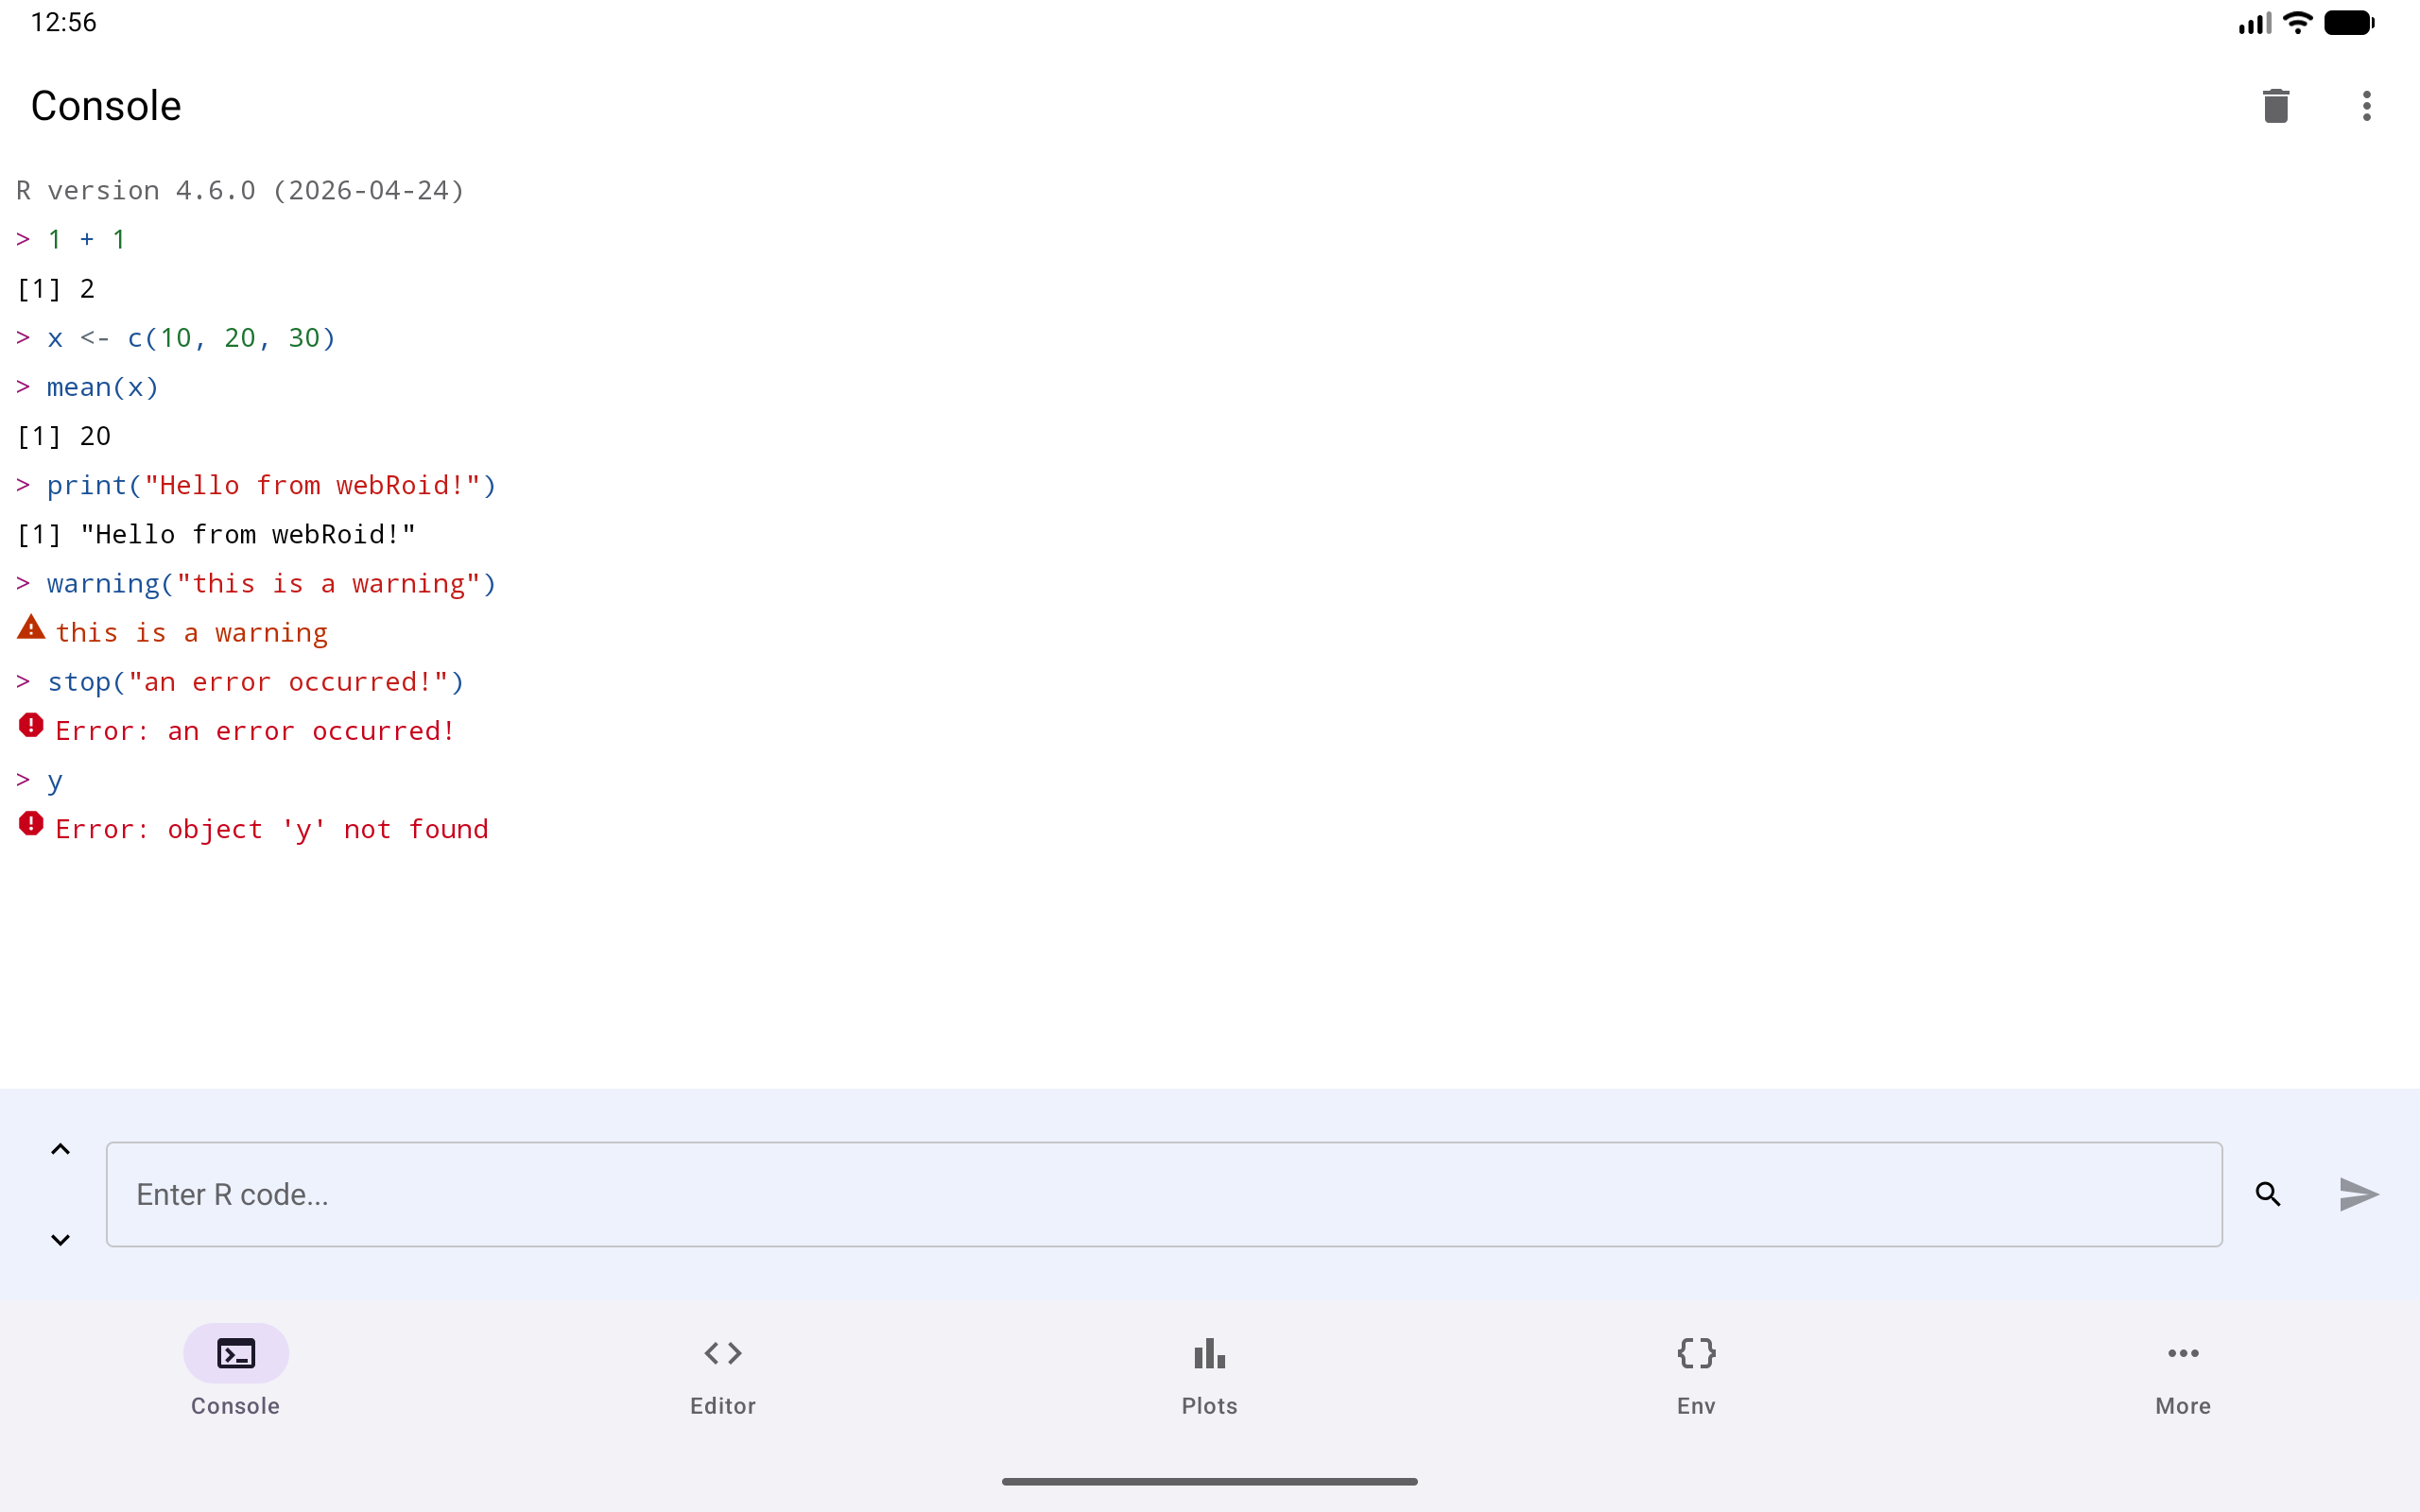
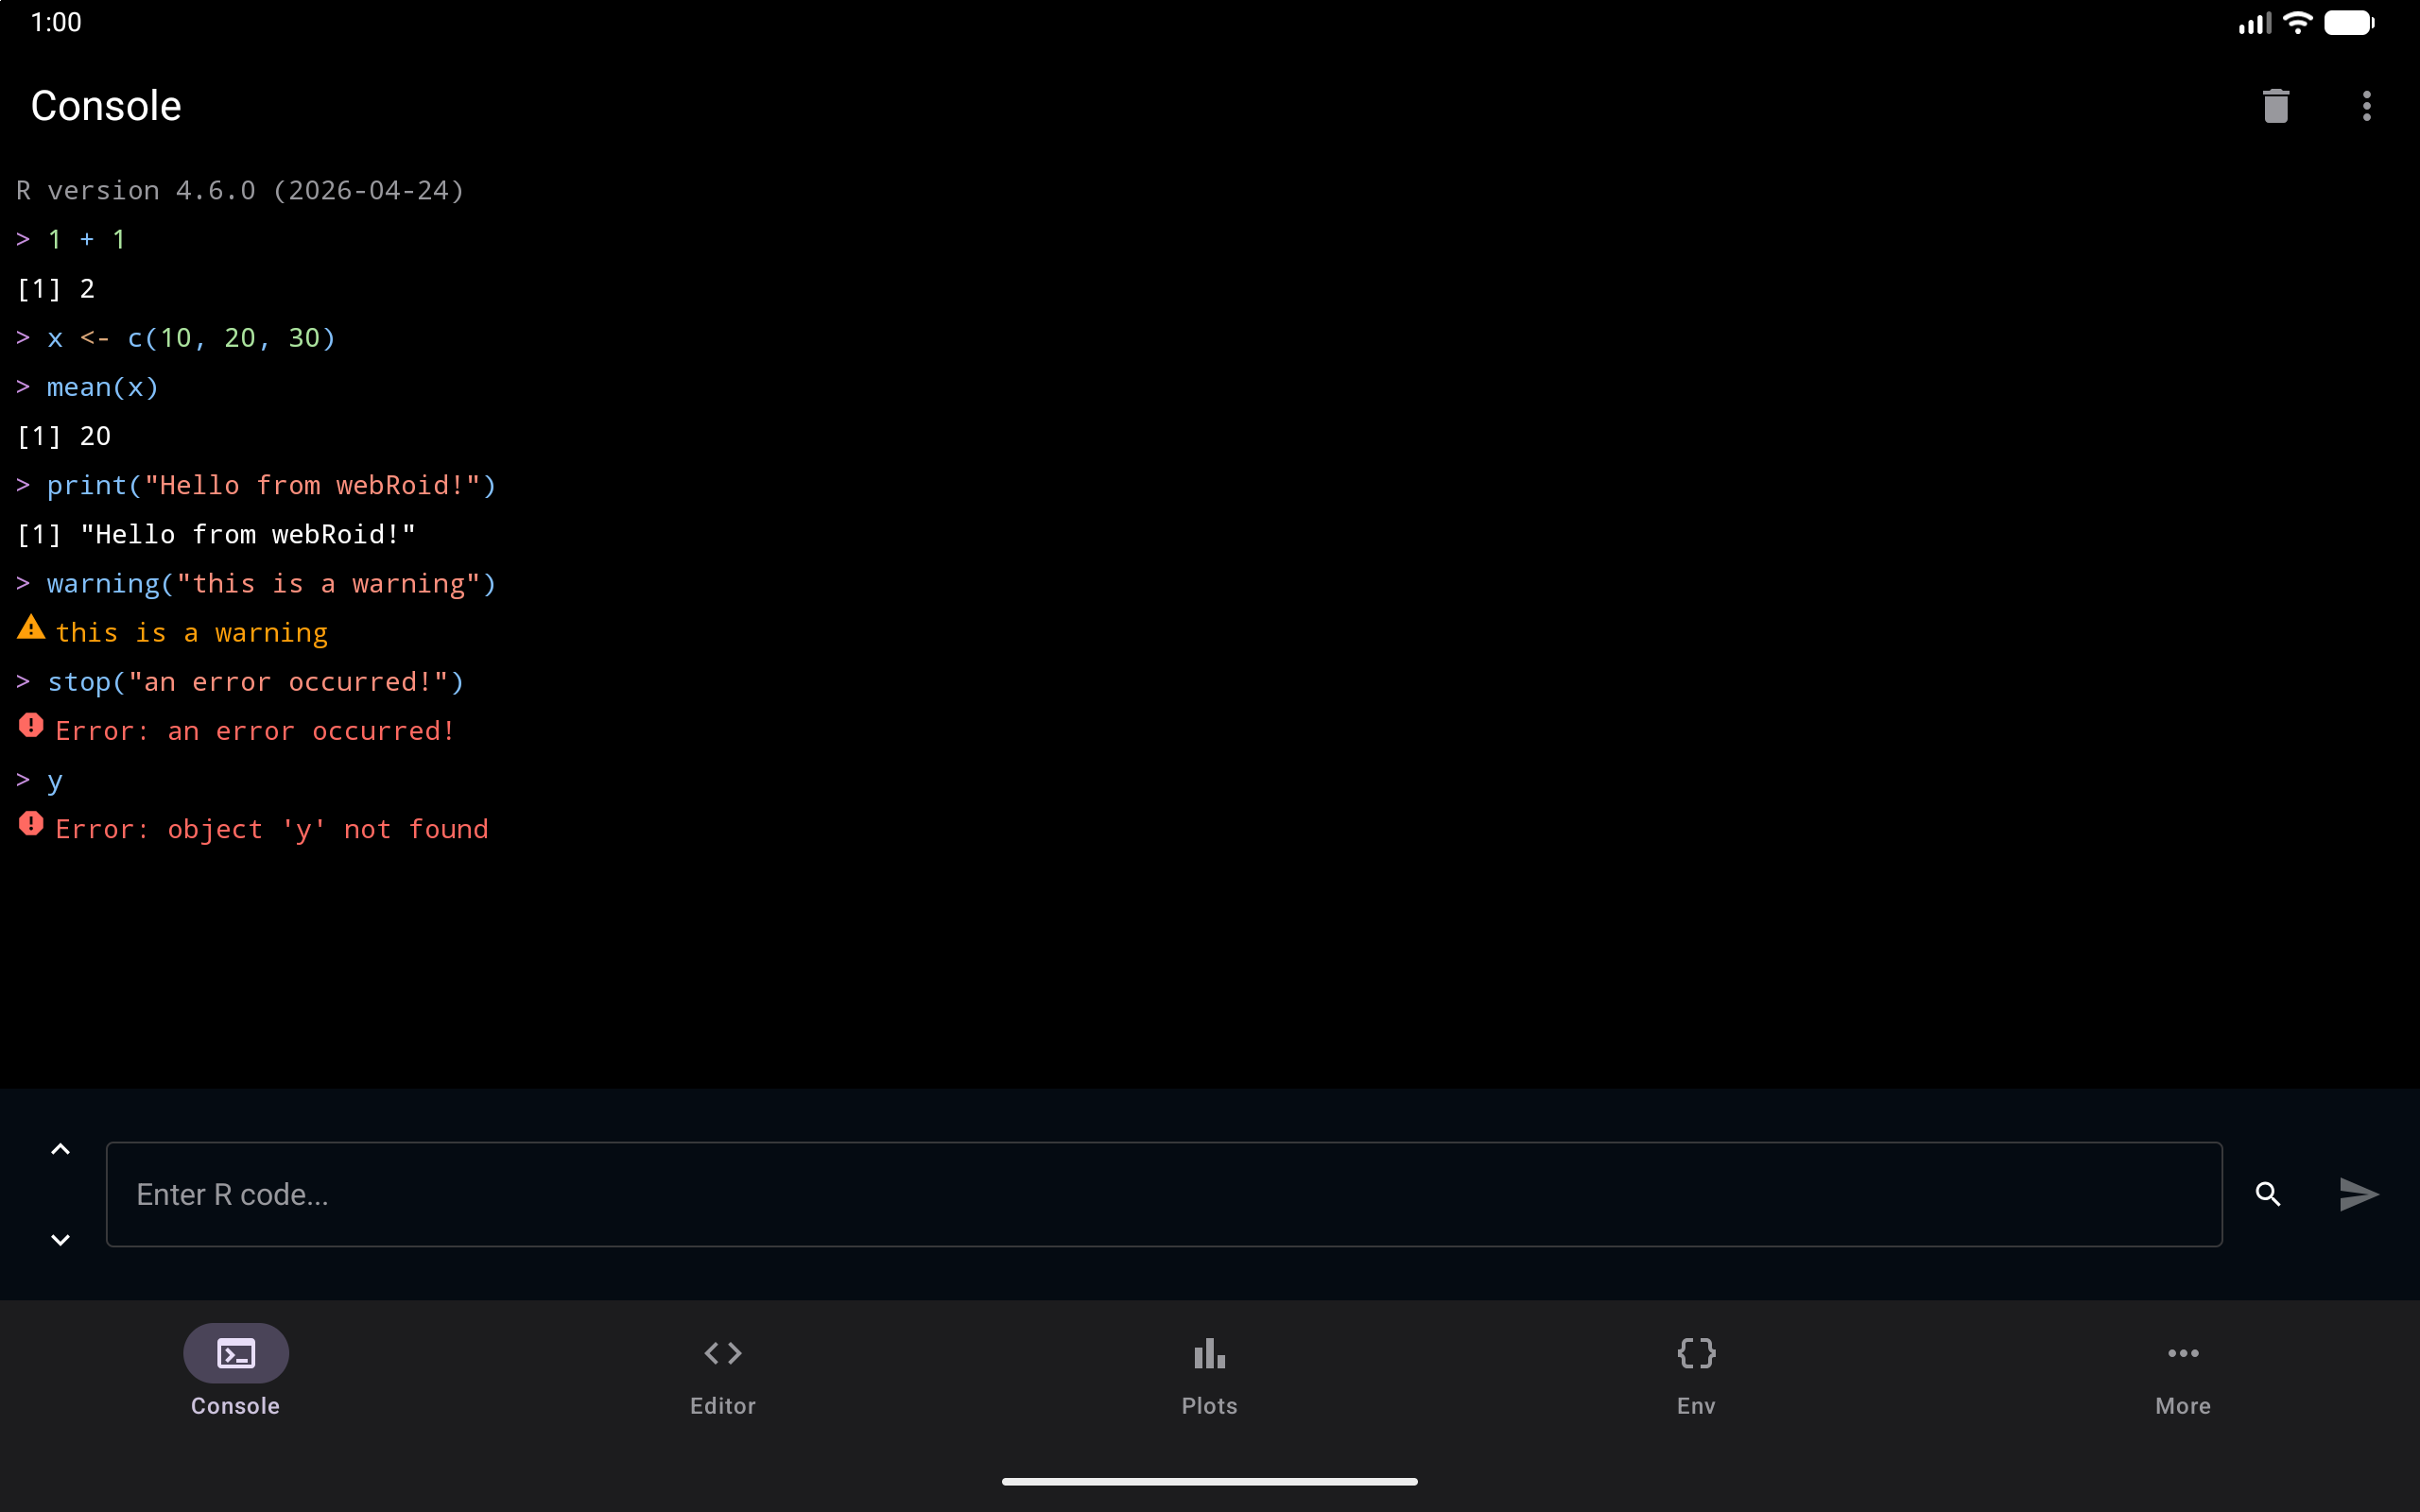
Each kind of output has its own color, so you can scan it quickly. In the screenshot below, each command you ran appears after a >, and the results are in the plain text color. The warning is orange, with a small triangle in front of it. The two errors are red, with an alert icon in front of them. Messages, the notes R and packages print along the way, show up in gray. The Output Colors section of the Console guide has the full list.
The console also has:
- Up/down arrows beside the input to navigate your command history
- A trash icon in the title bar to clear the console output
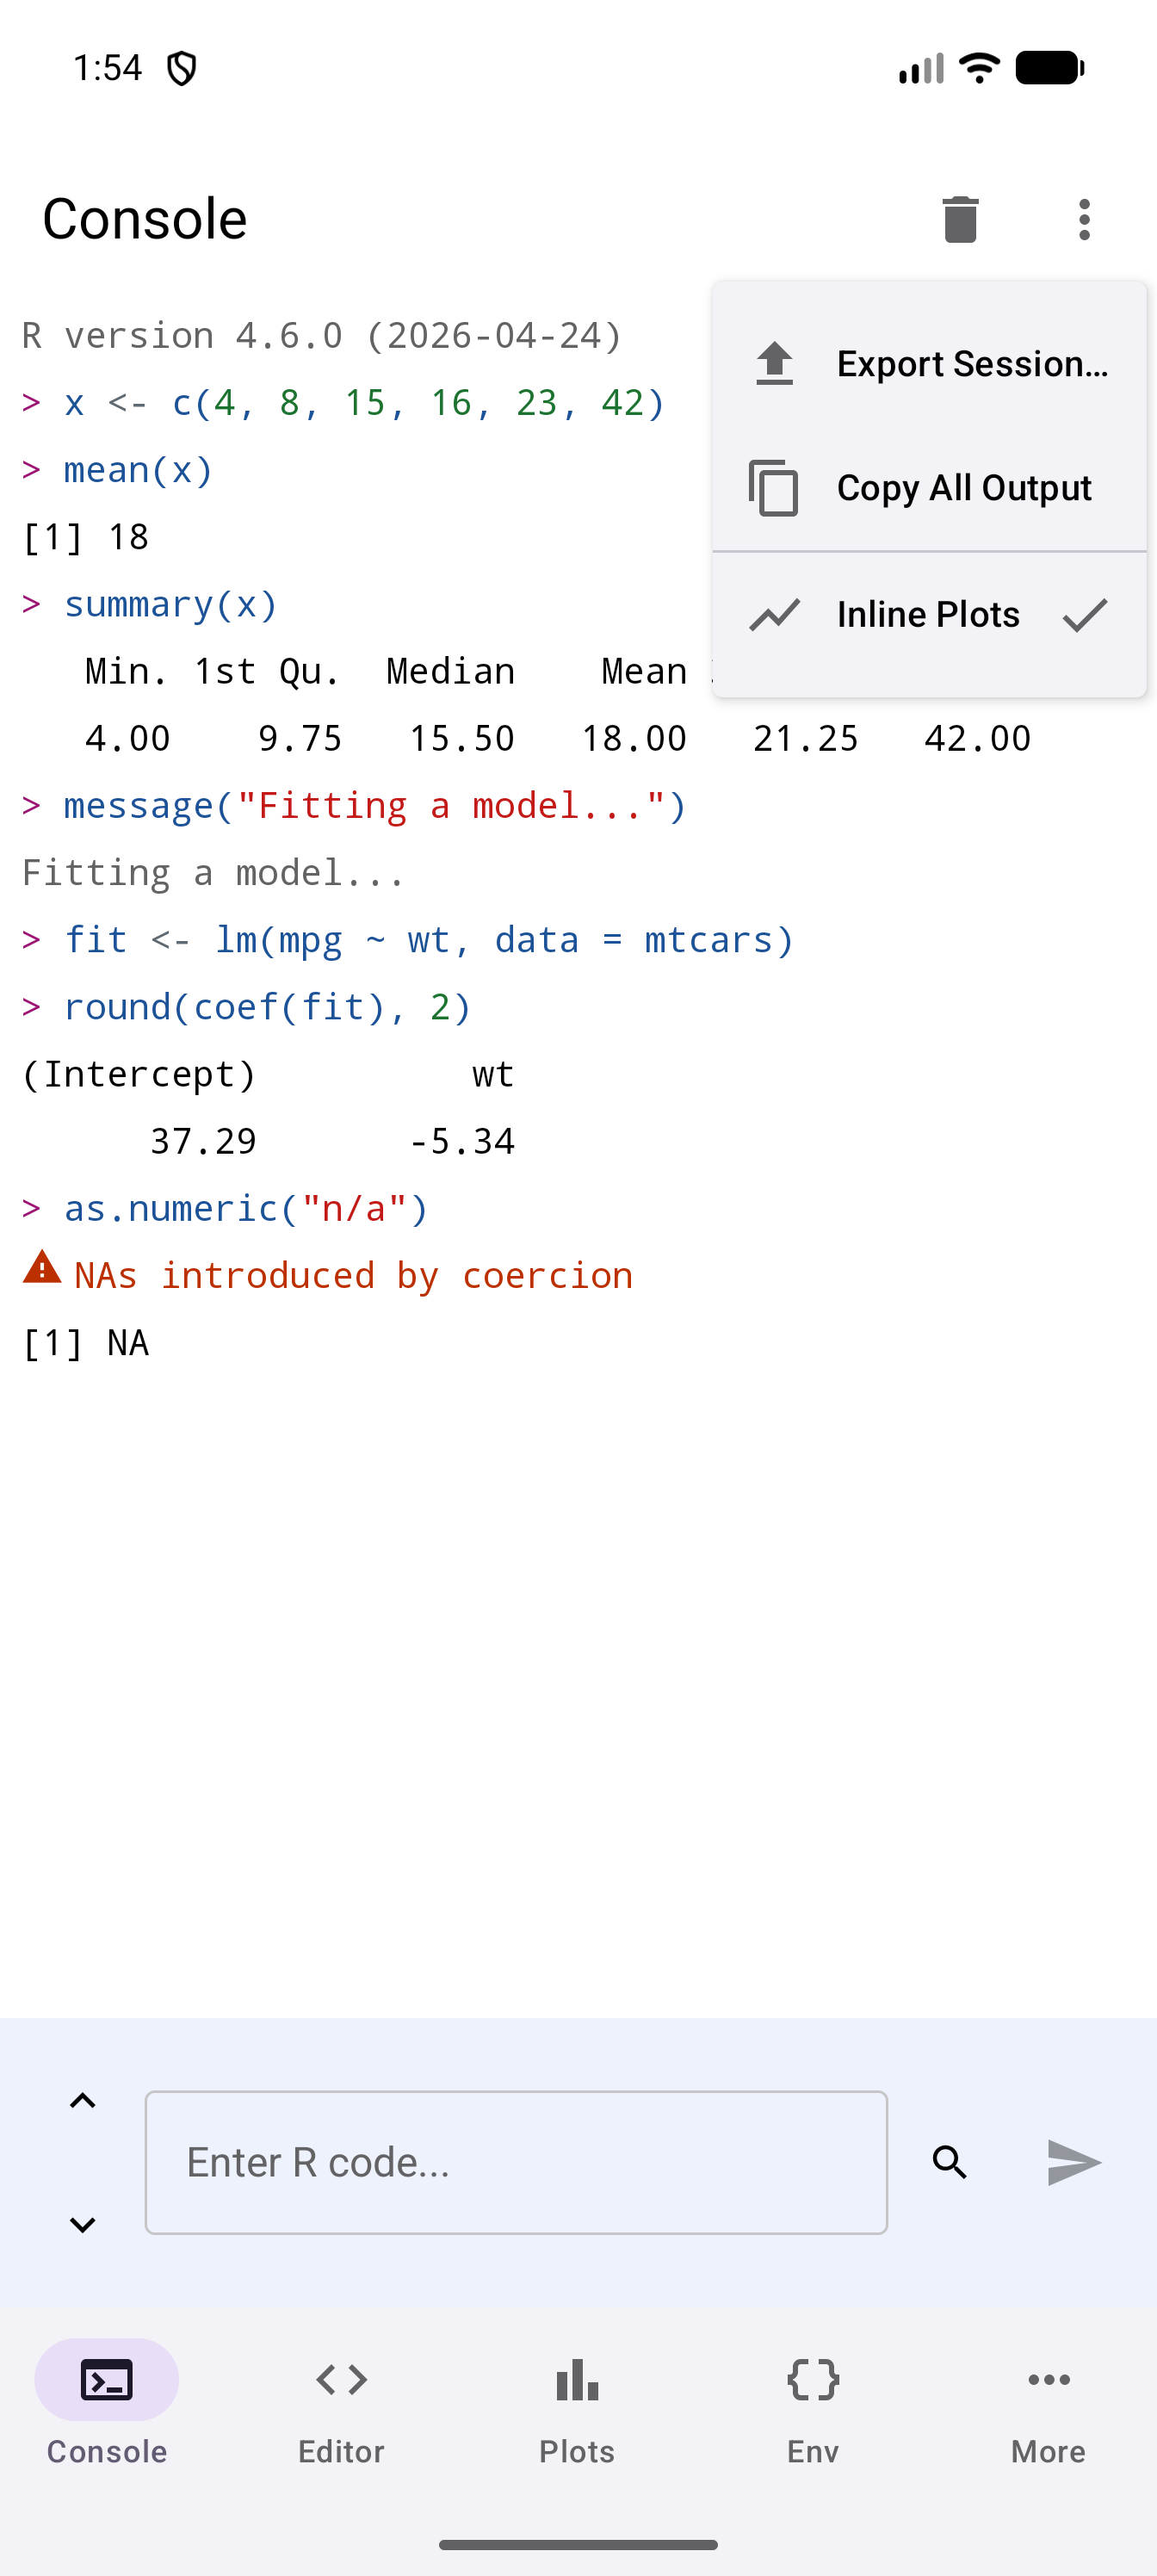
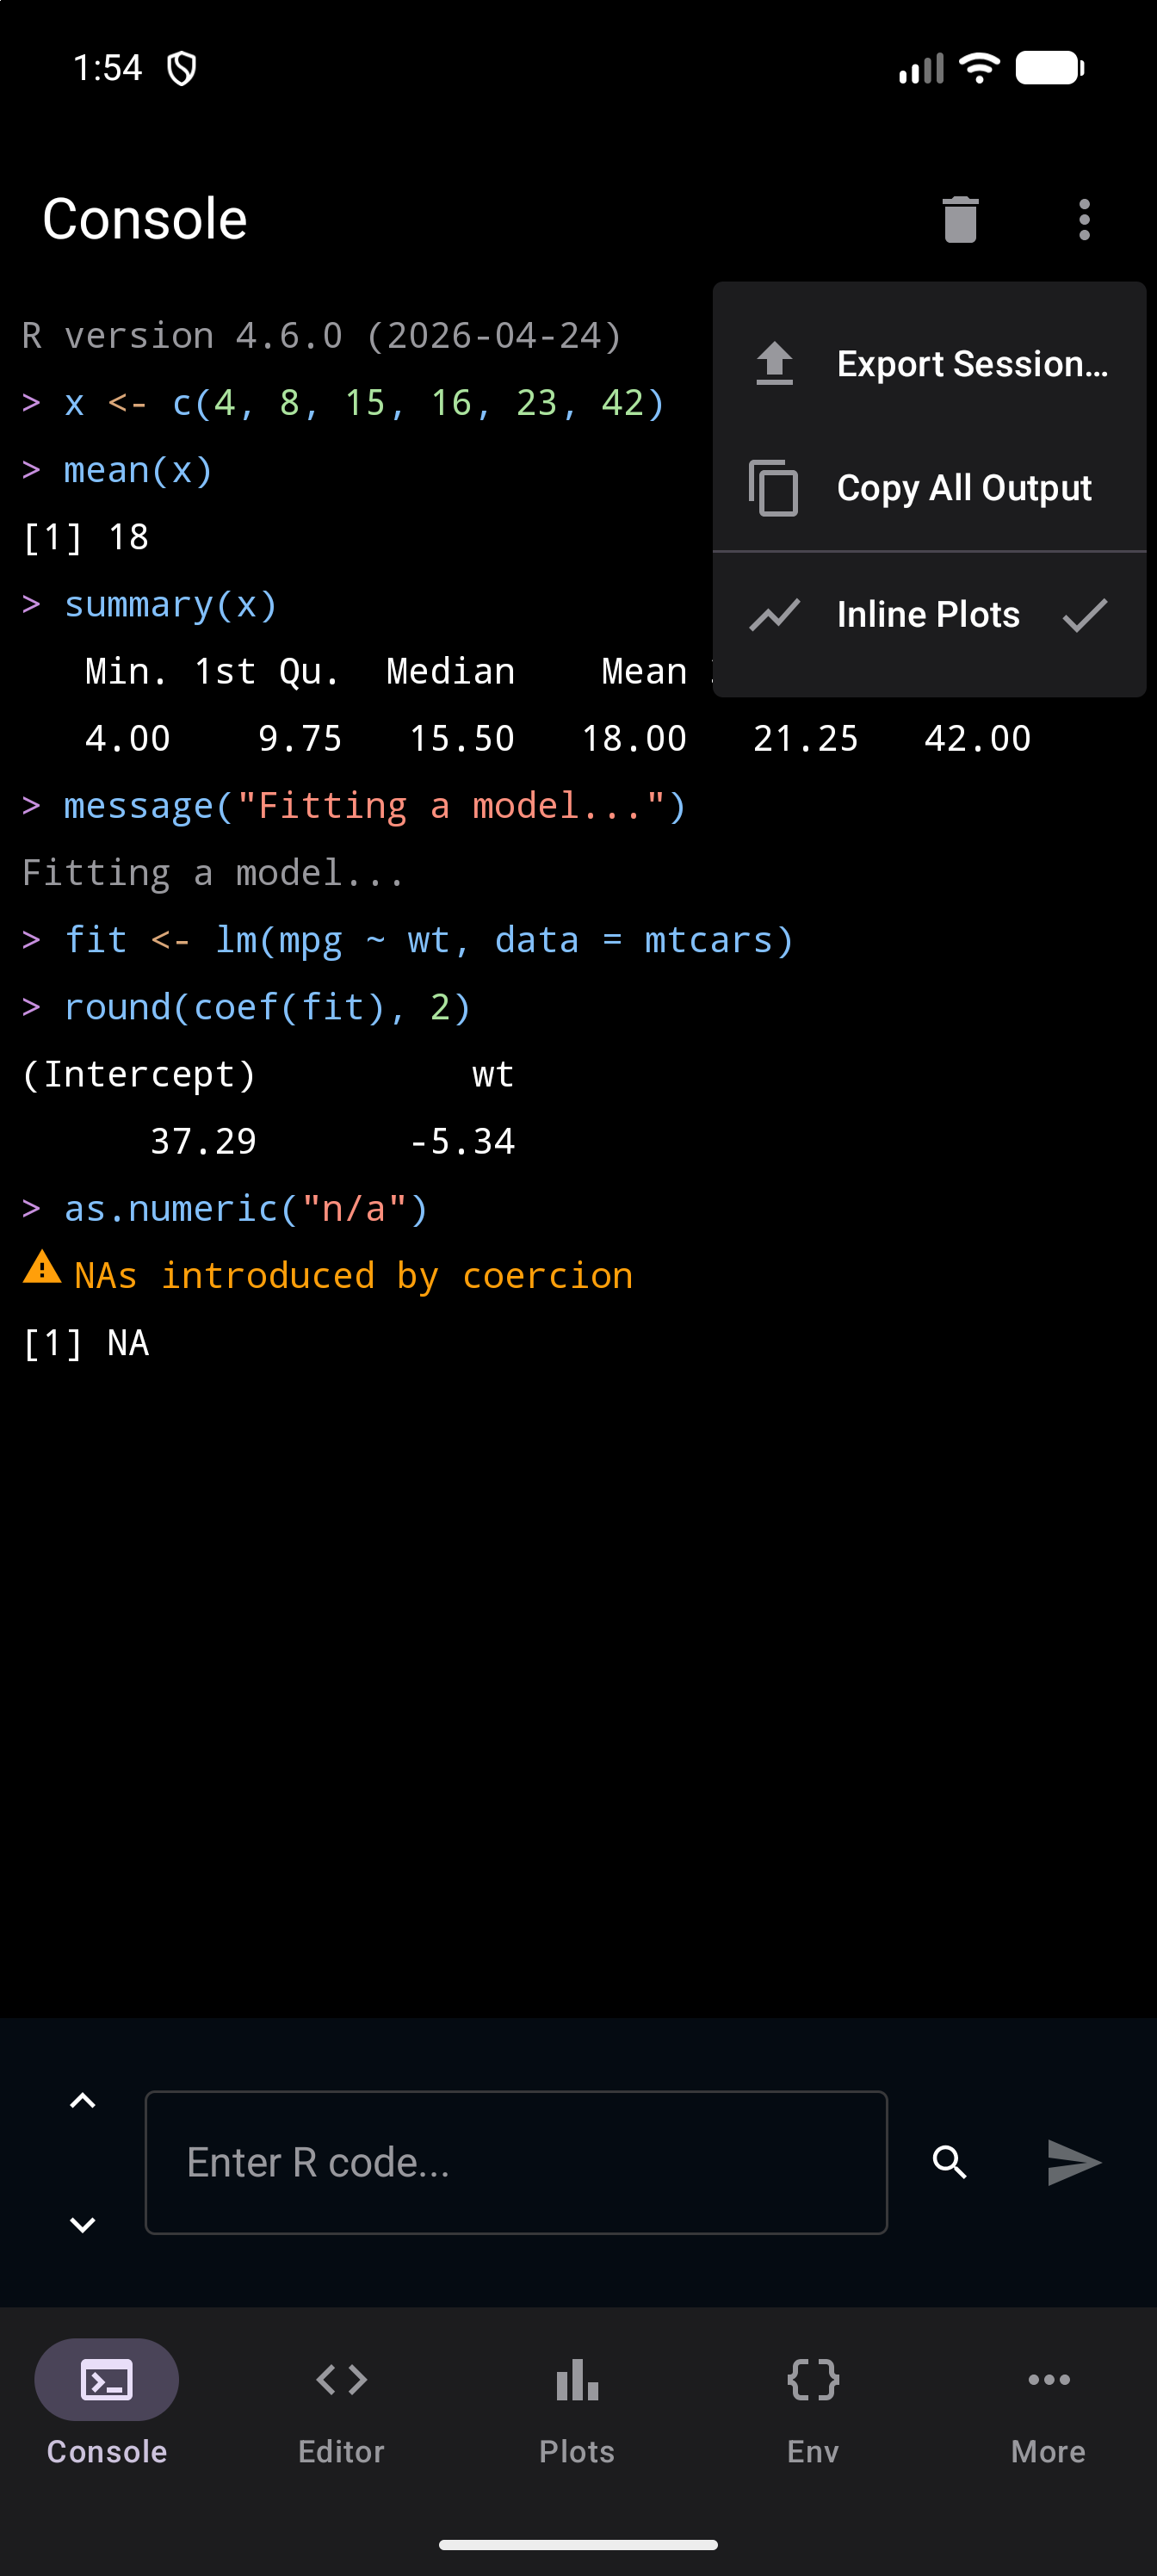
- A three-dot menu beside it with Export Session…, Copy All Output and Inline Plots; see Console
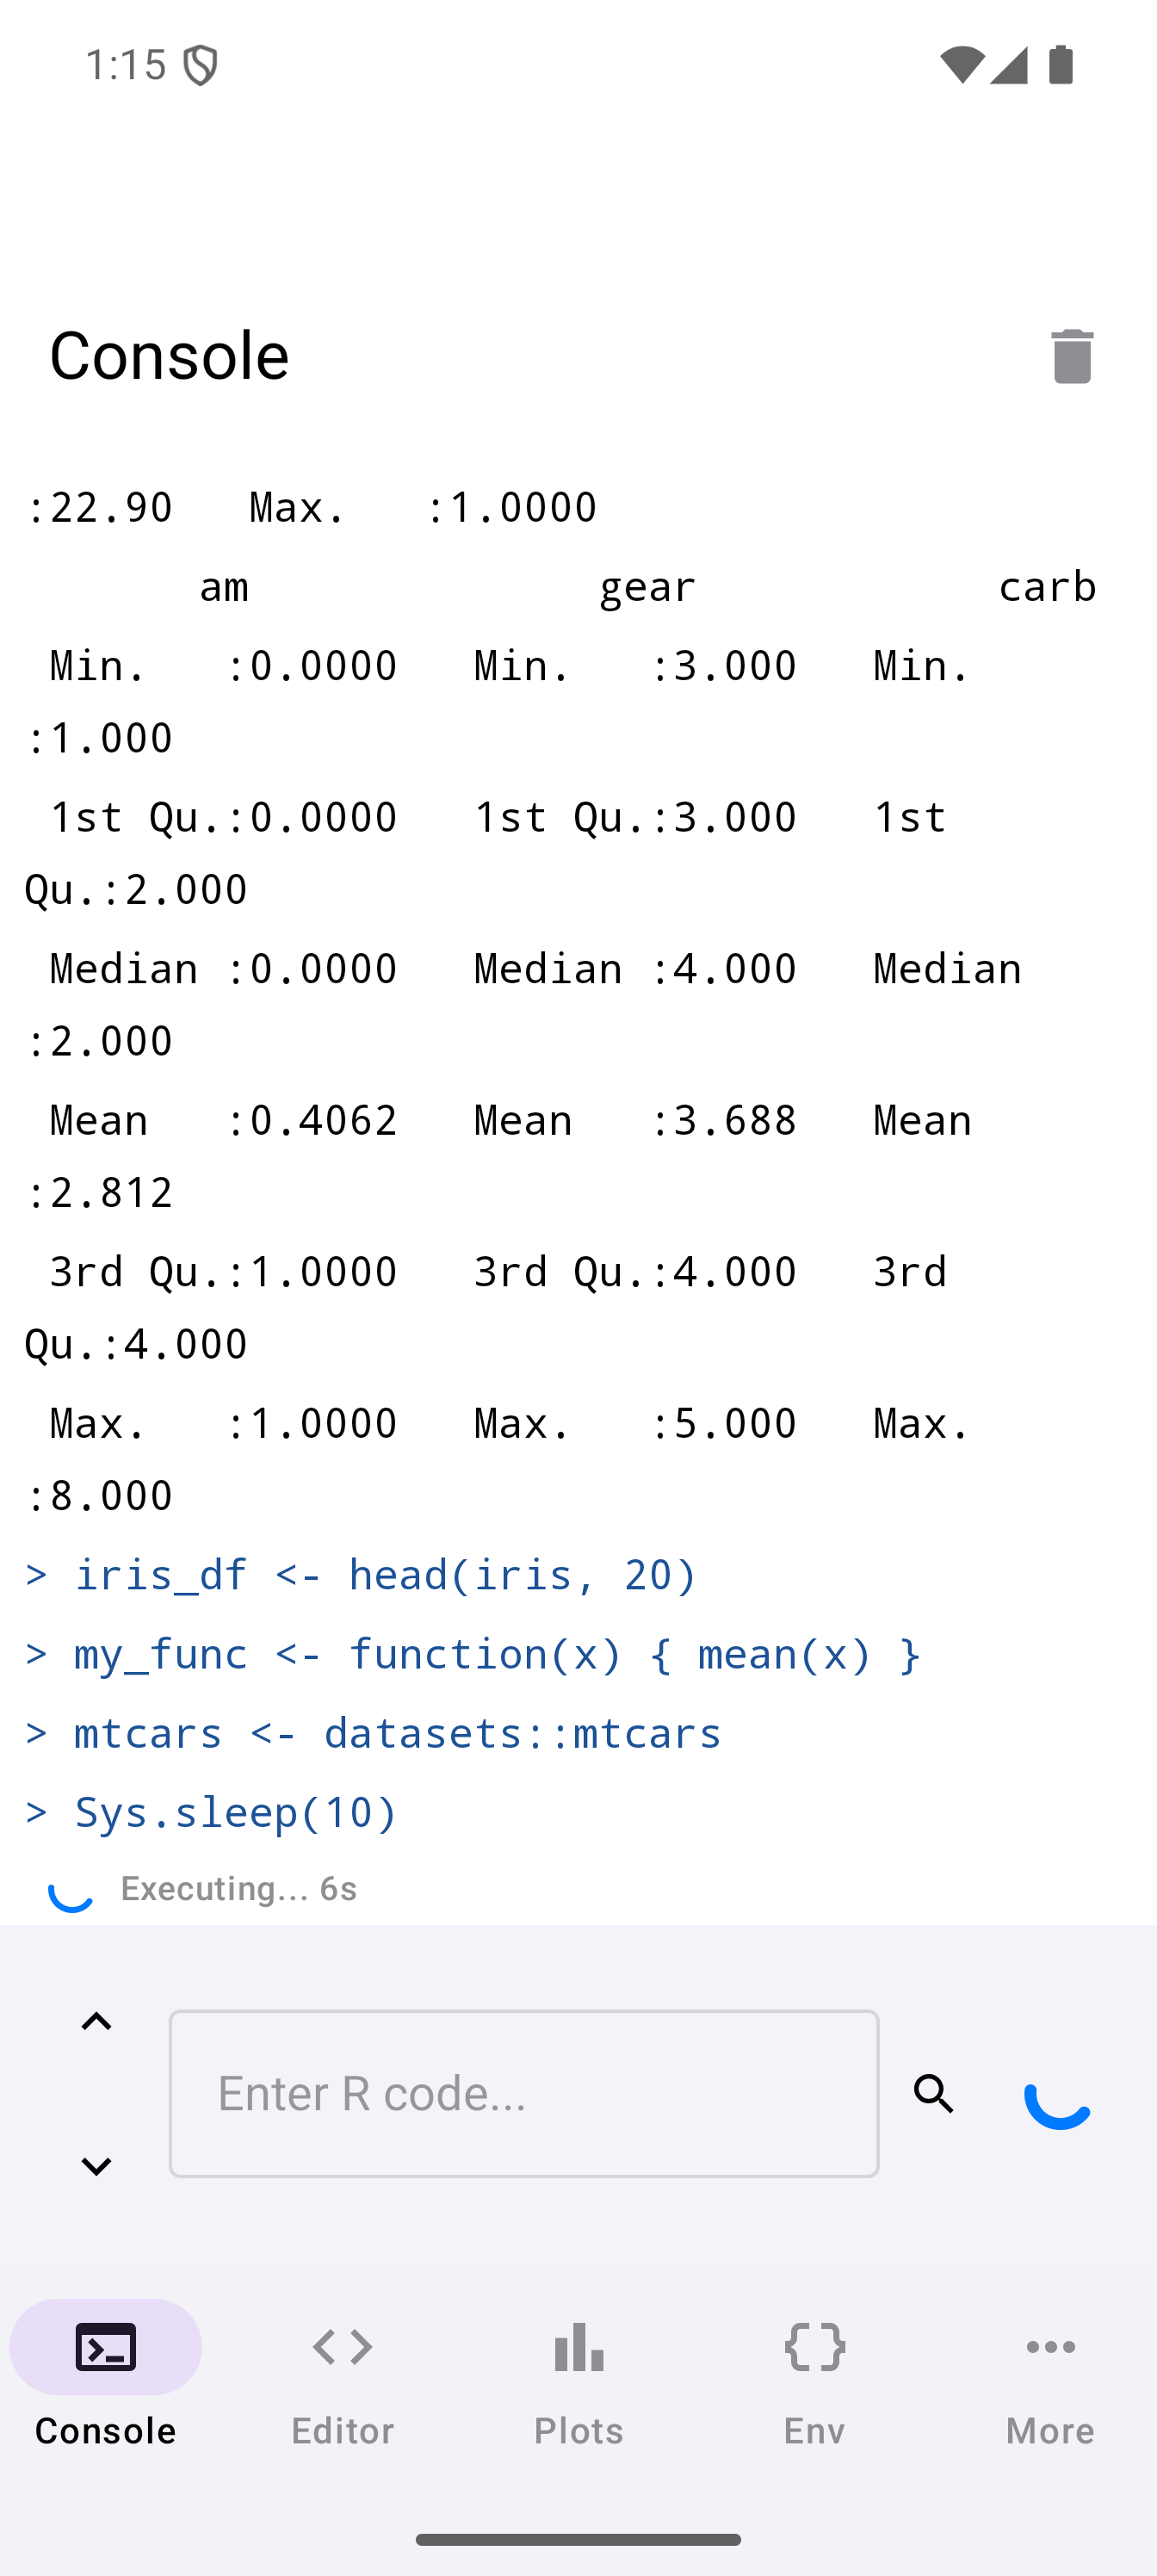
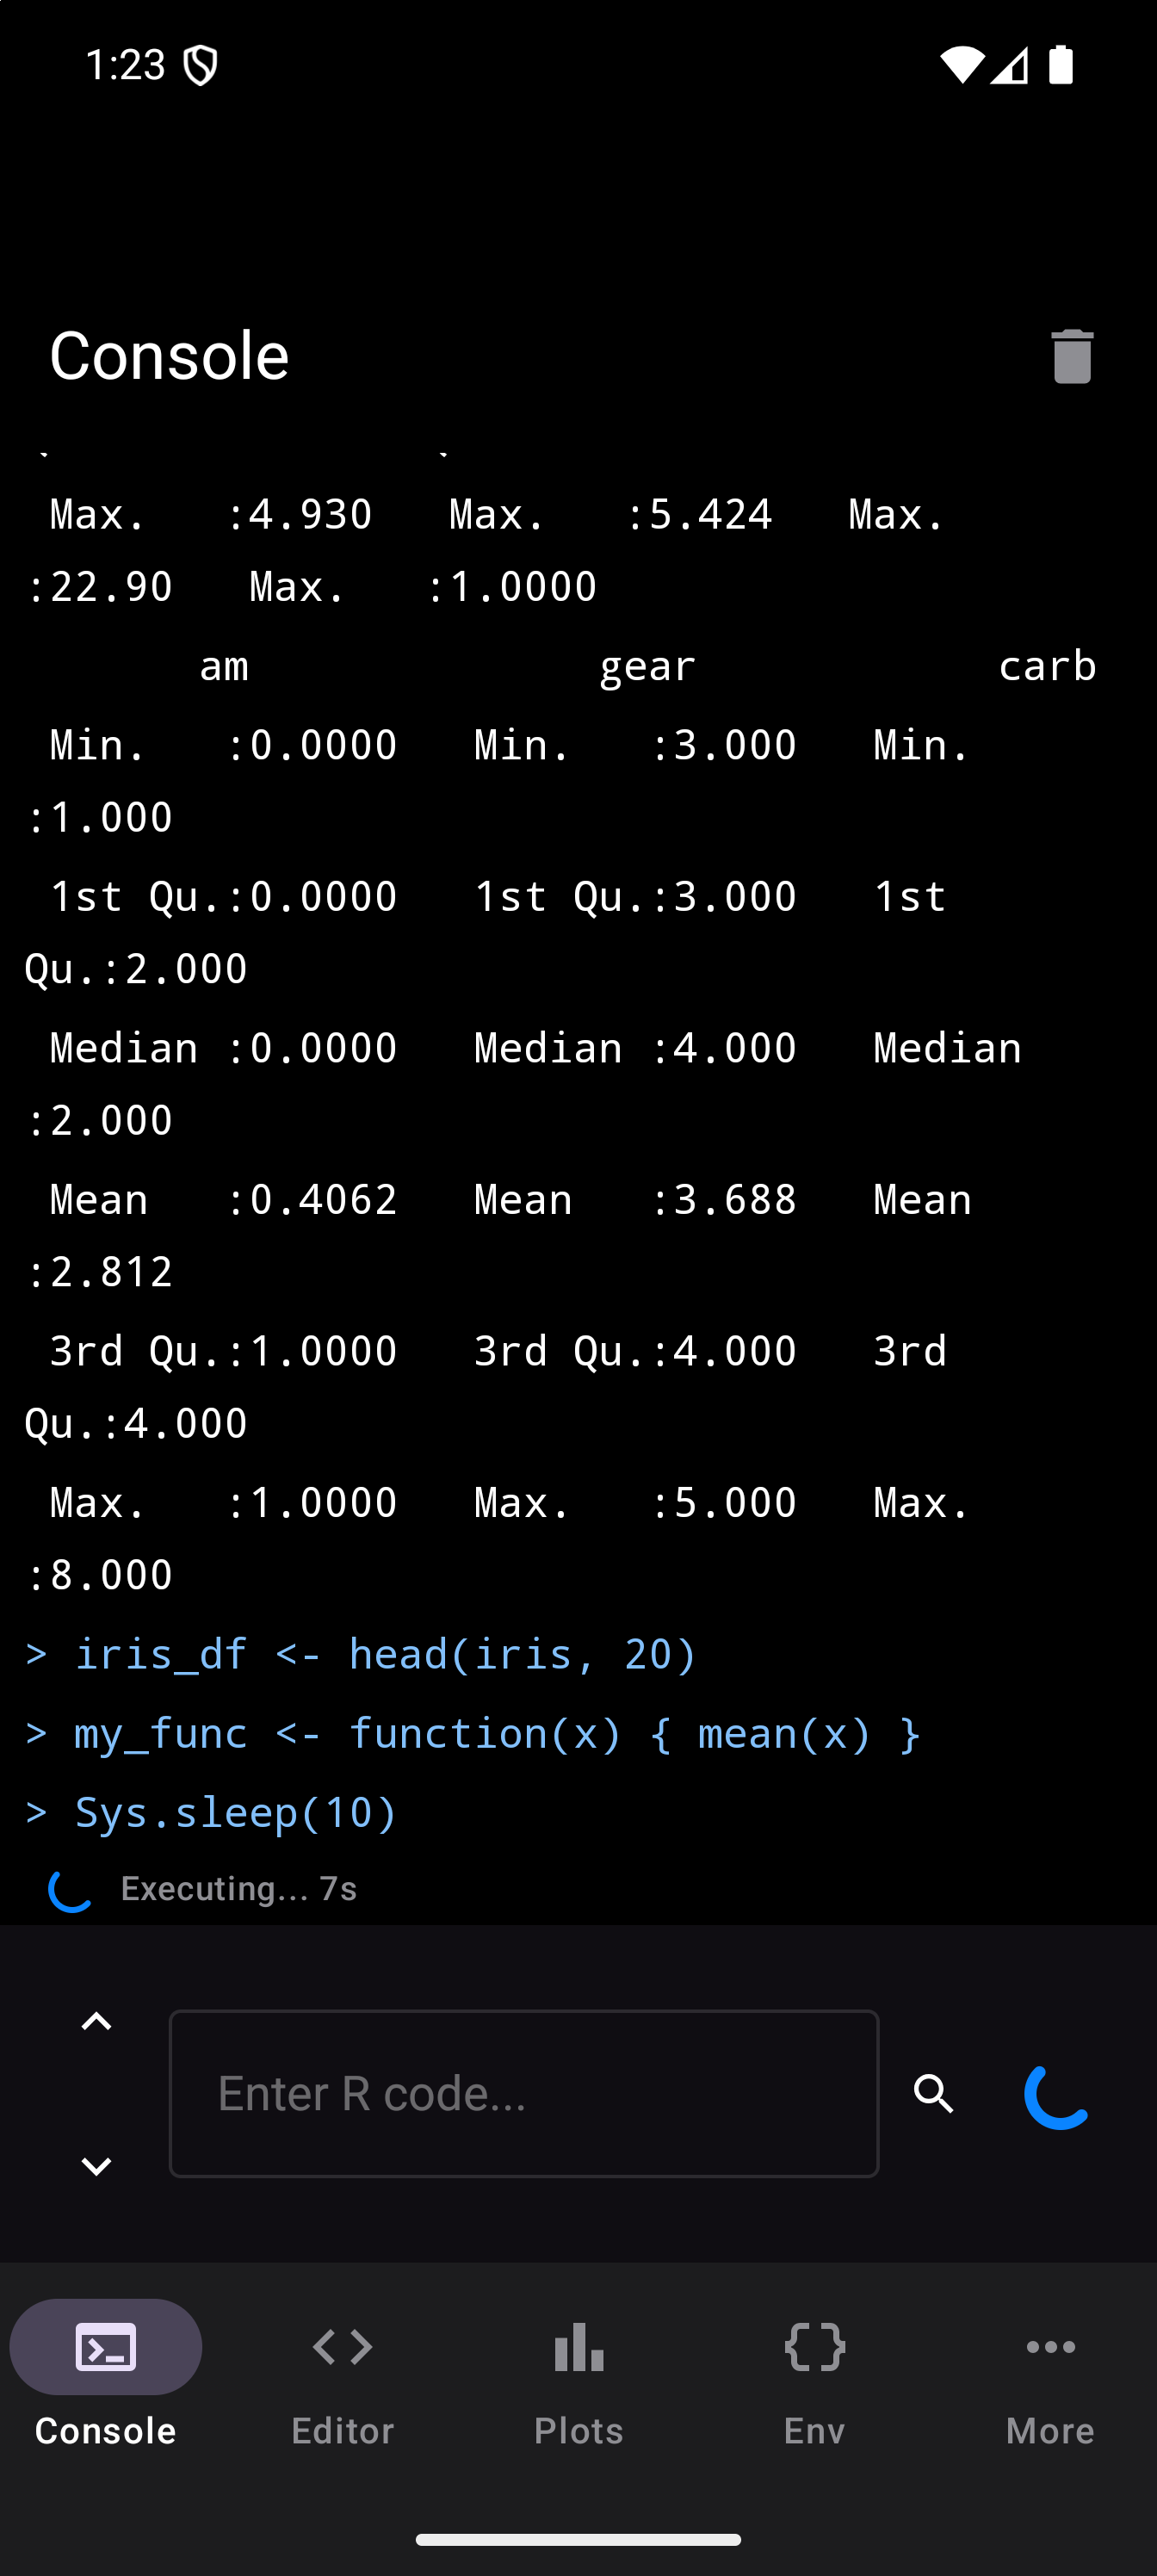
While code is running, you will see a progress indicator showing how long the computation has been executing.
Your First Plot
R’s plotting capabilities work out of the box in webRoid. Try generating a scatter plot from the console:
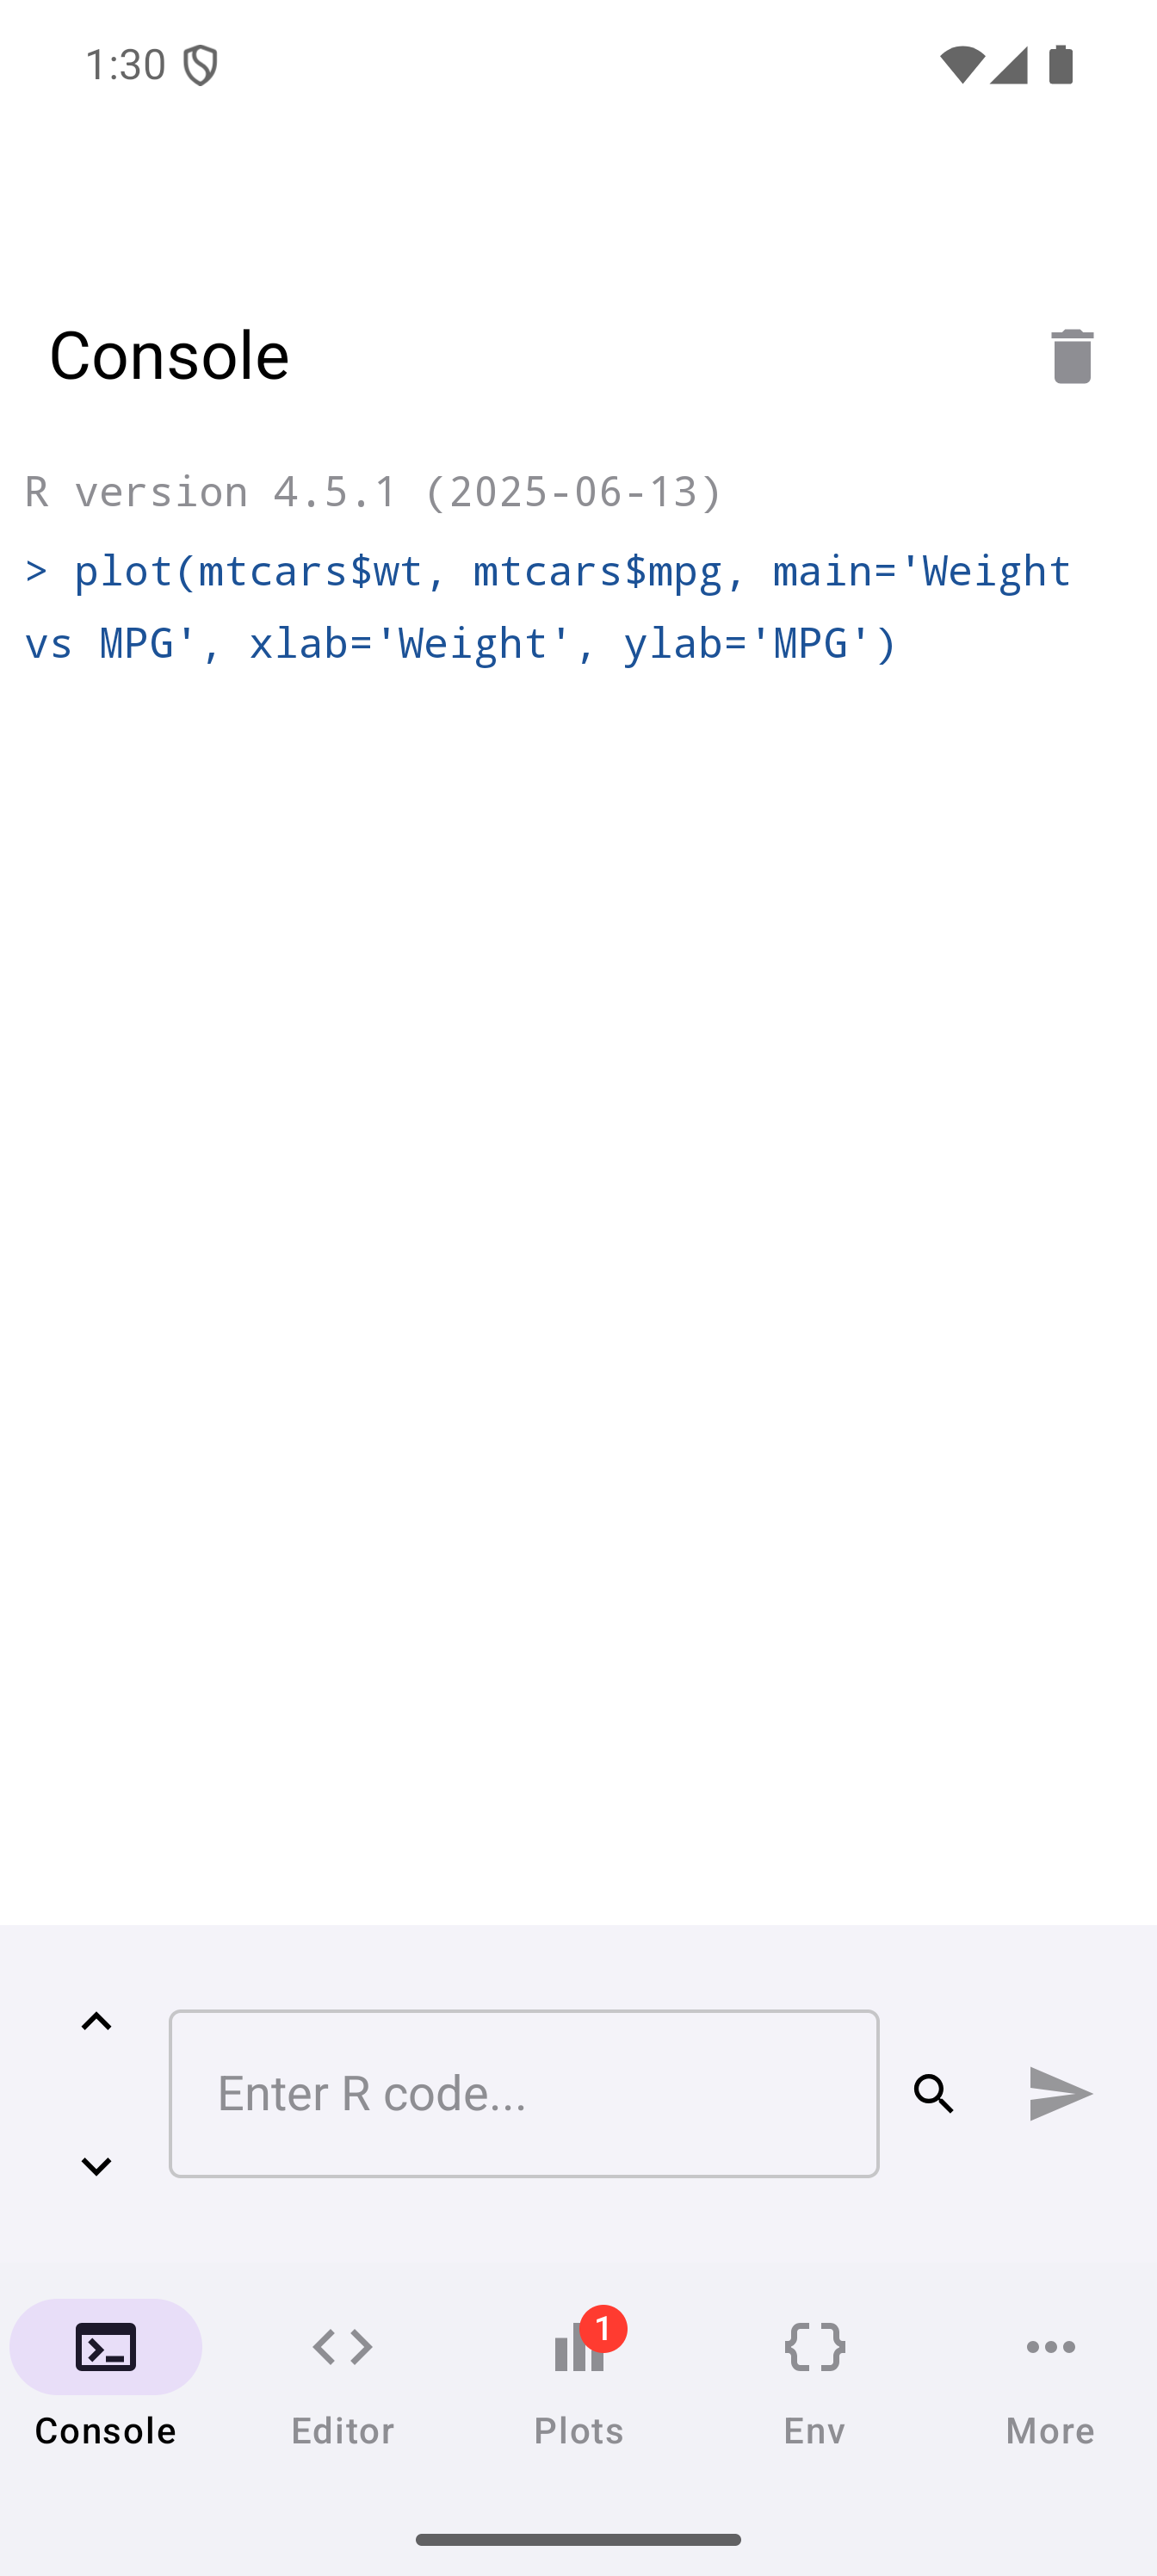
plot(mtcars$wt, mtcars$mpg, main = "Weight vs MPG", xlab = "Weight", ylab = "MPG")When a plot is generated, a badge appears on the Plots tab icon in the bottom navigation bar showing how many unseen plots are waiting. Tap the Plots tab to see your plot in the gallery.
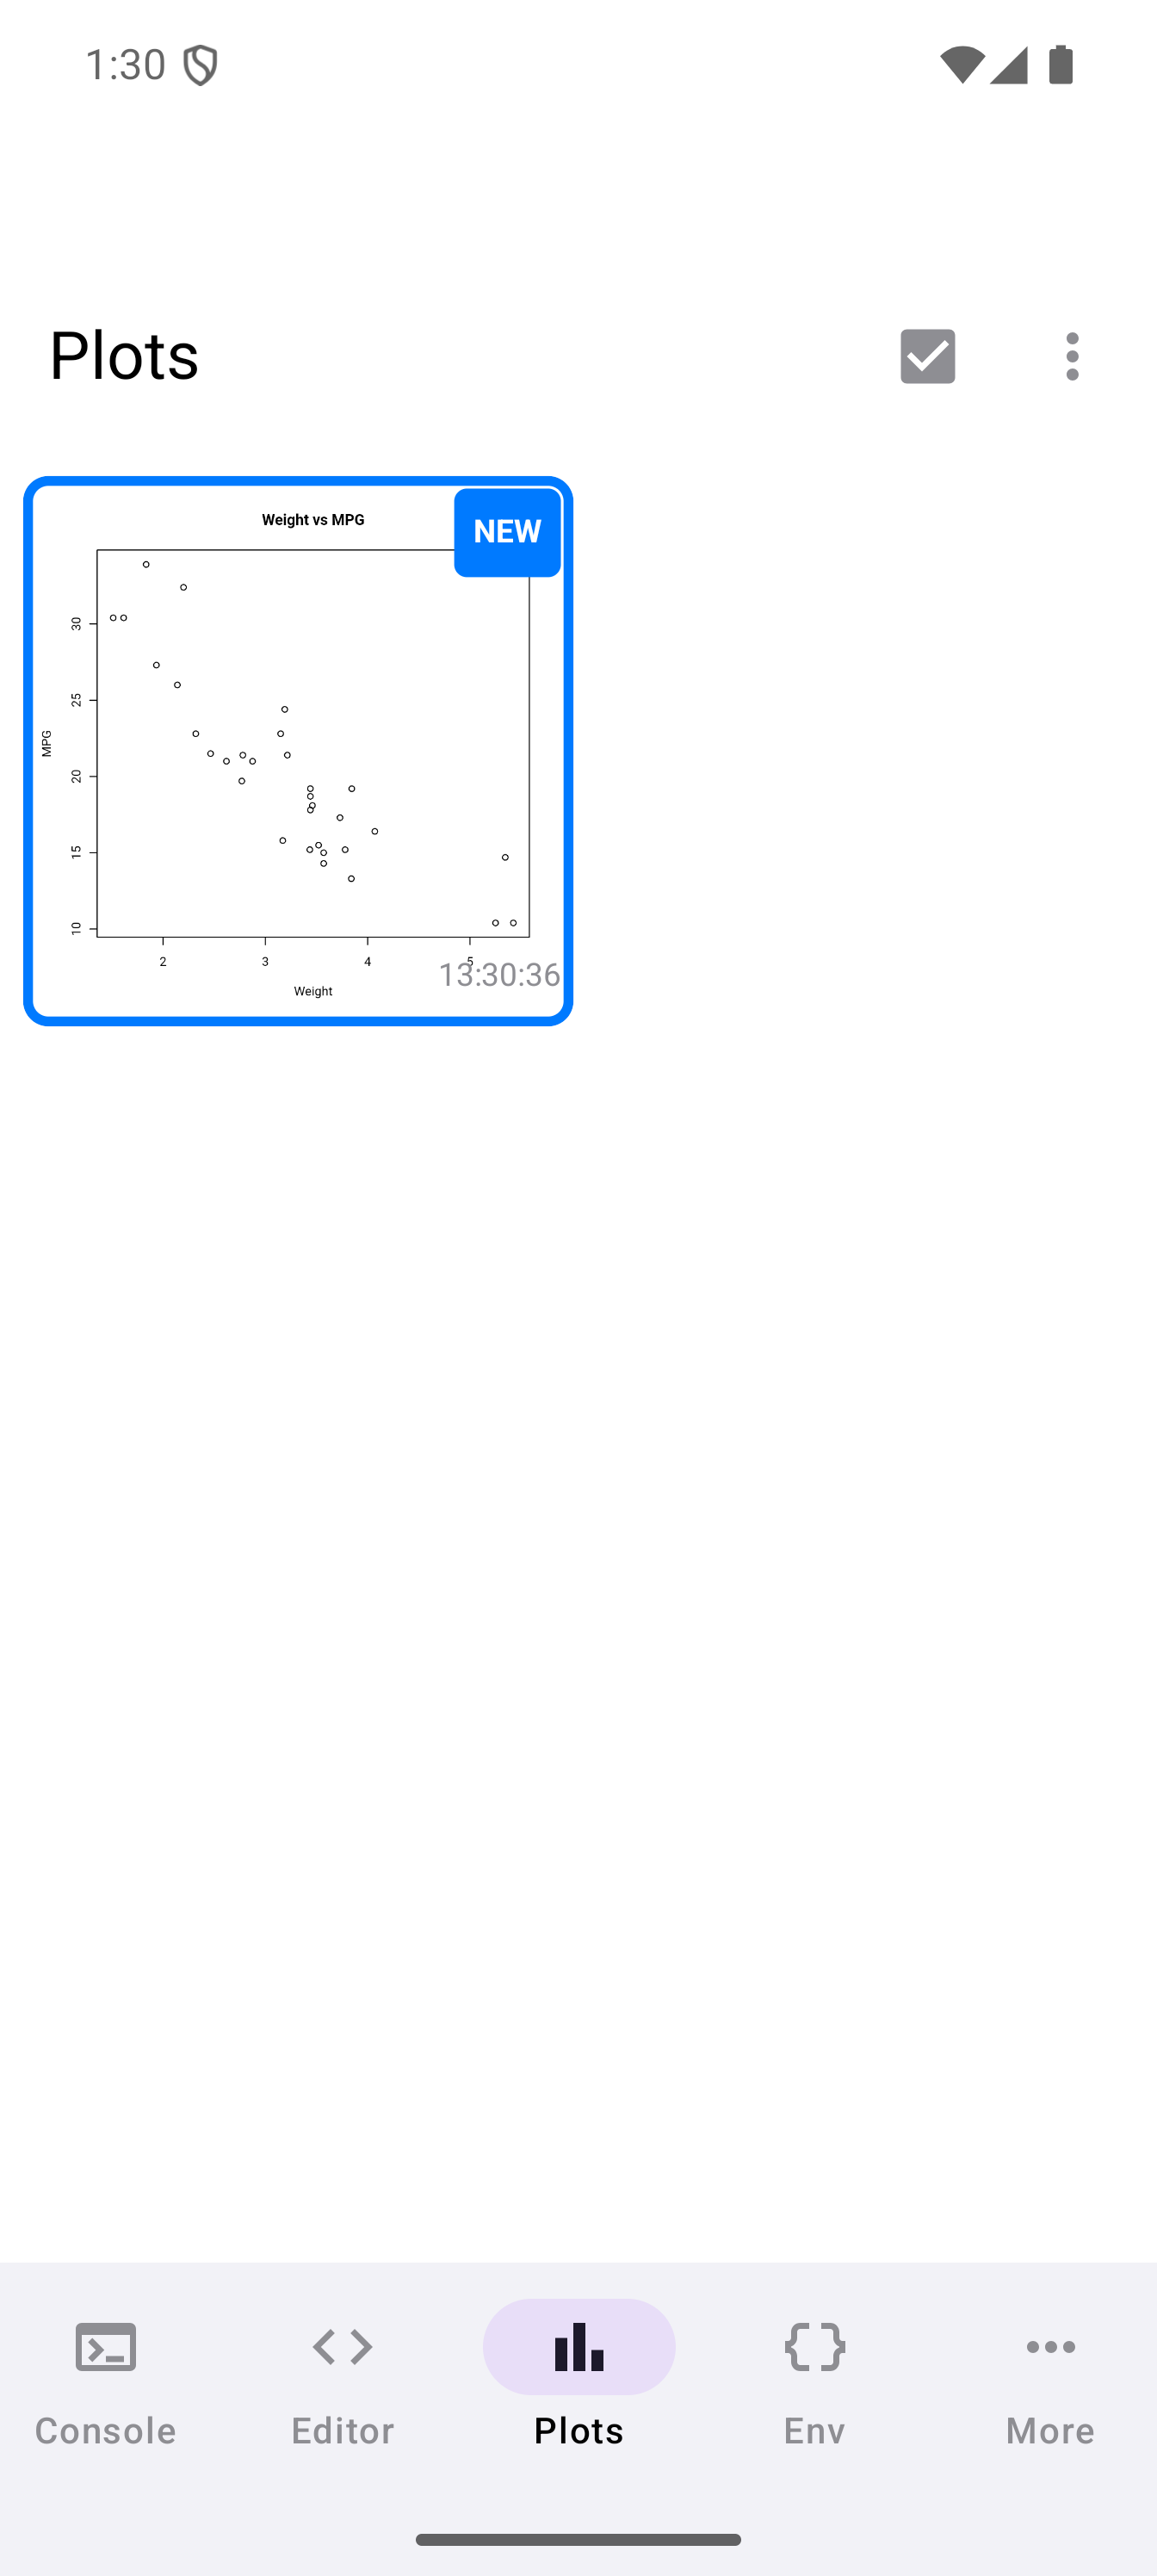
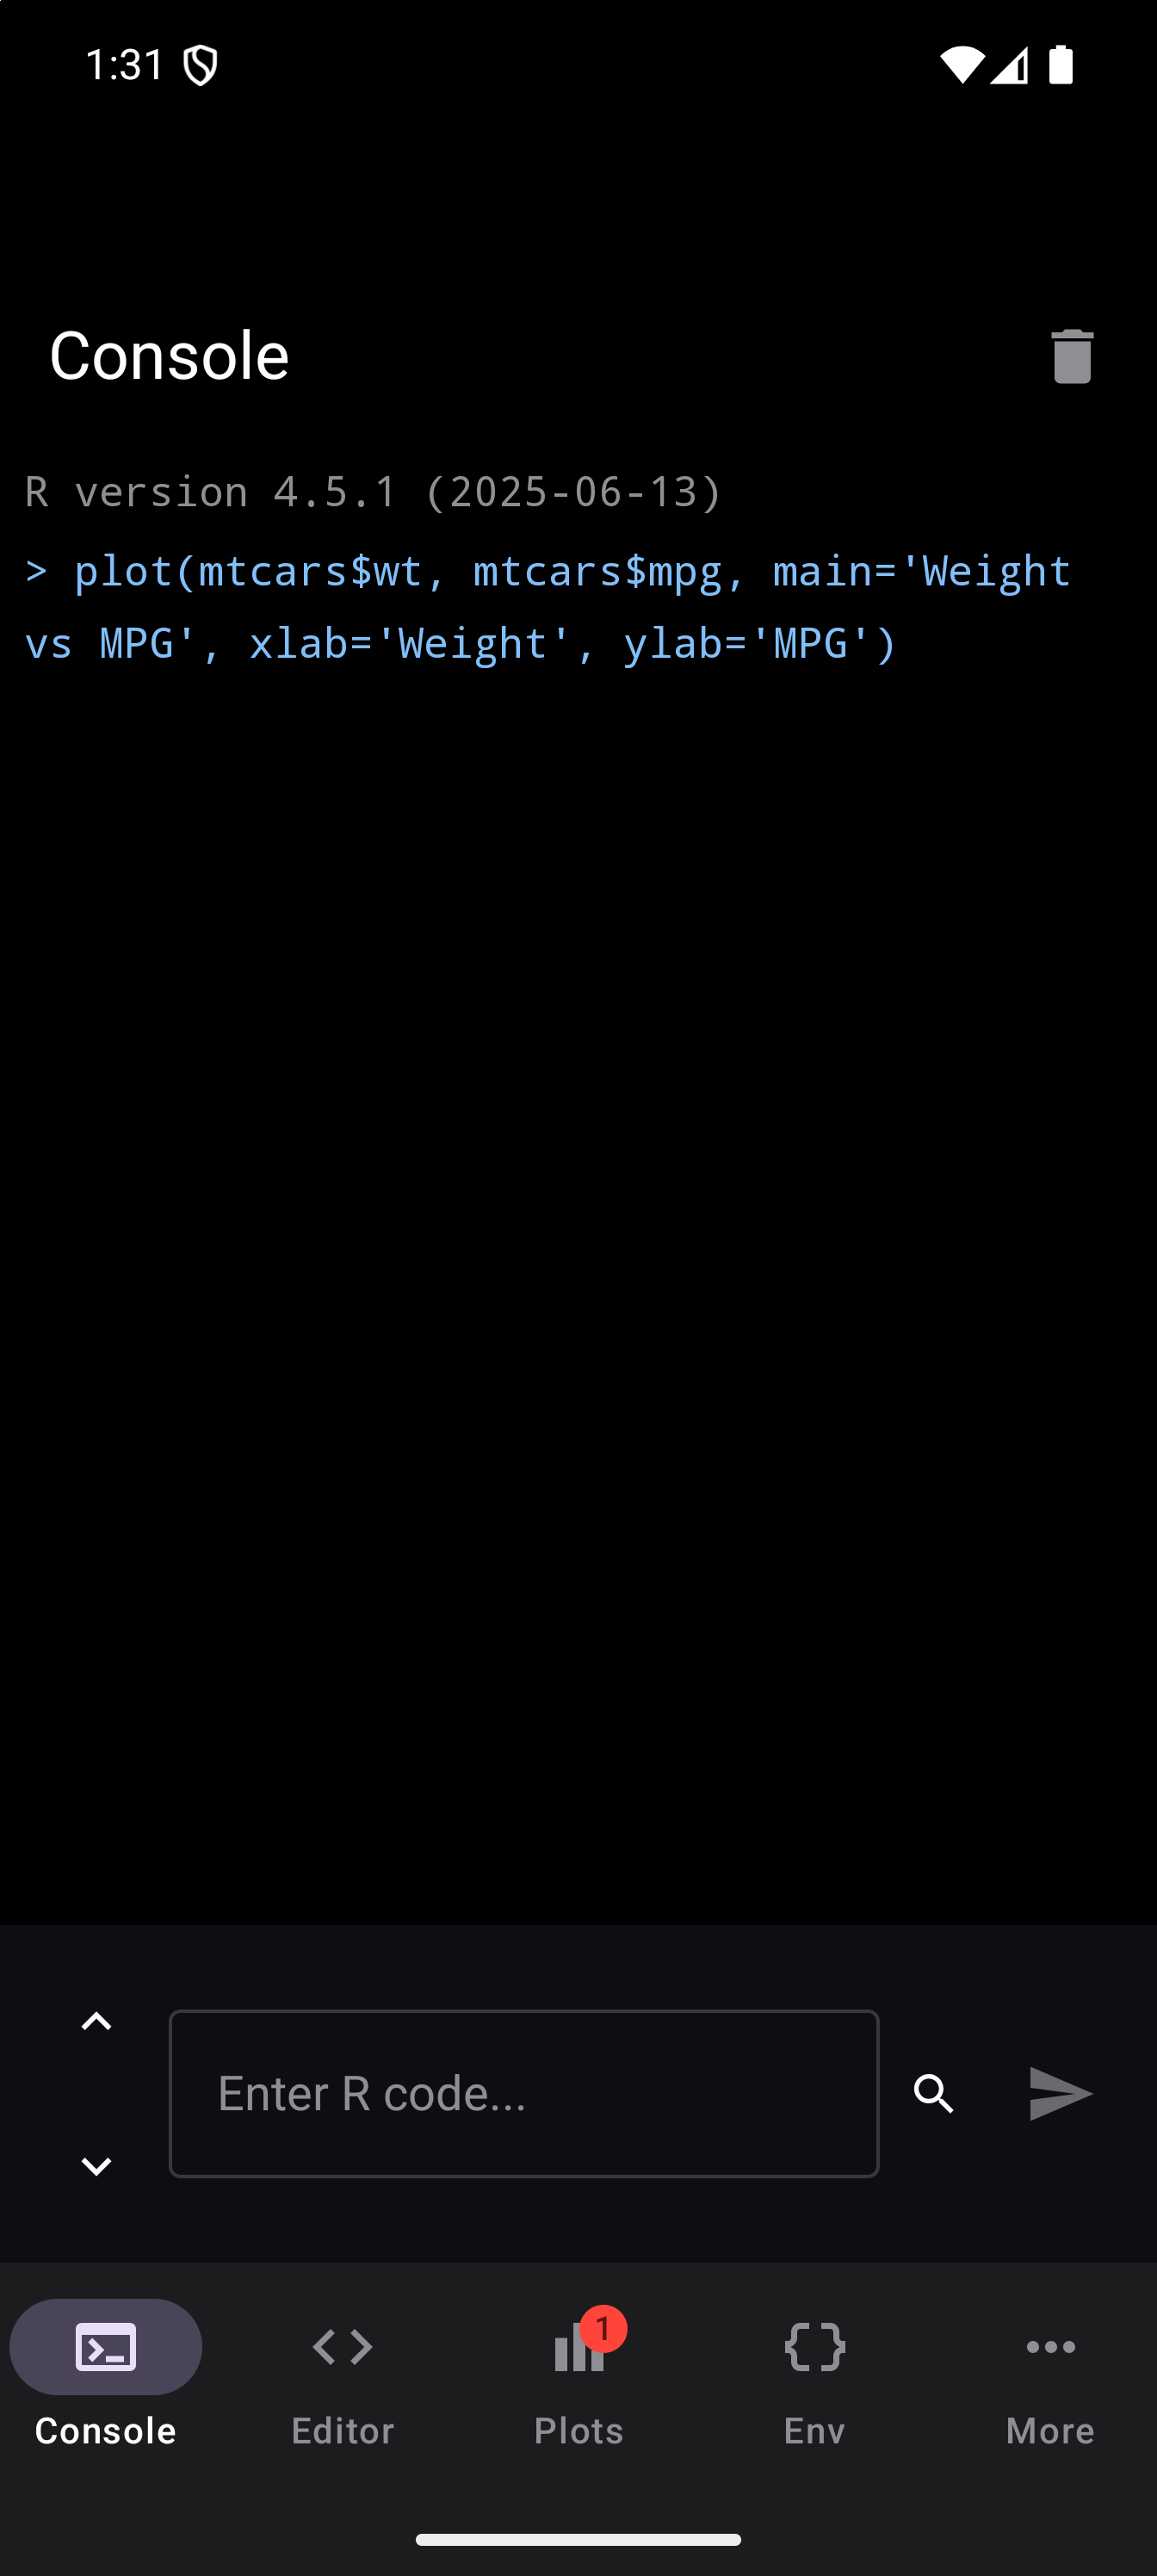
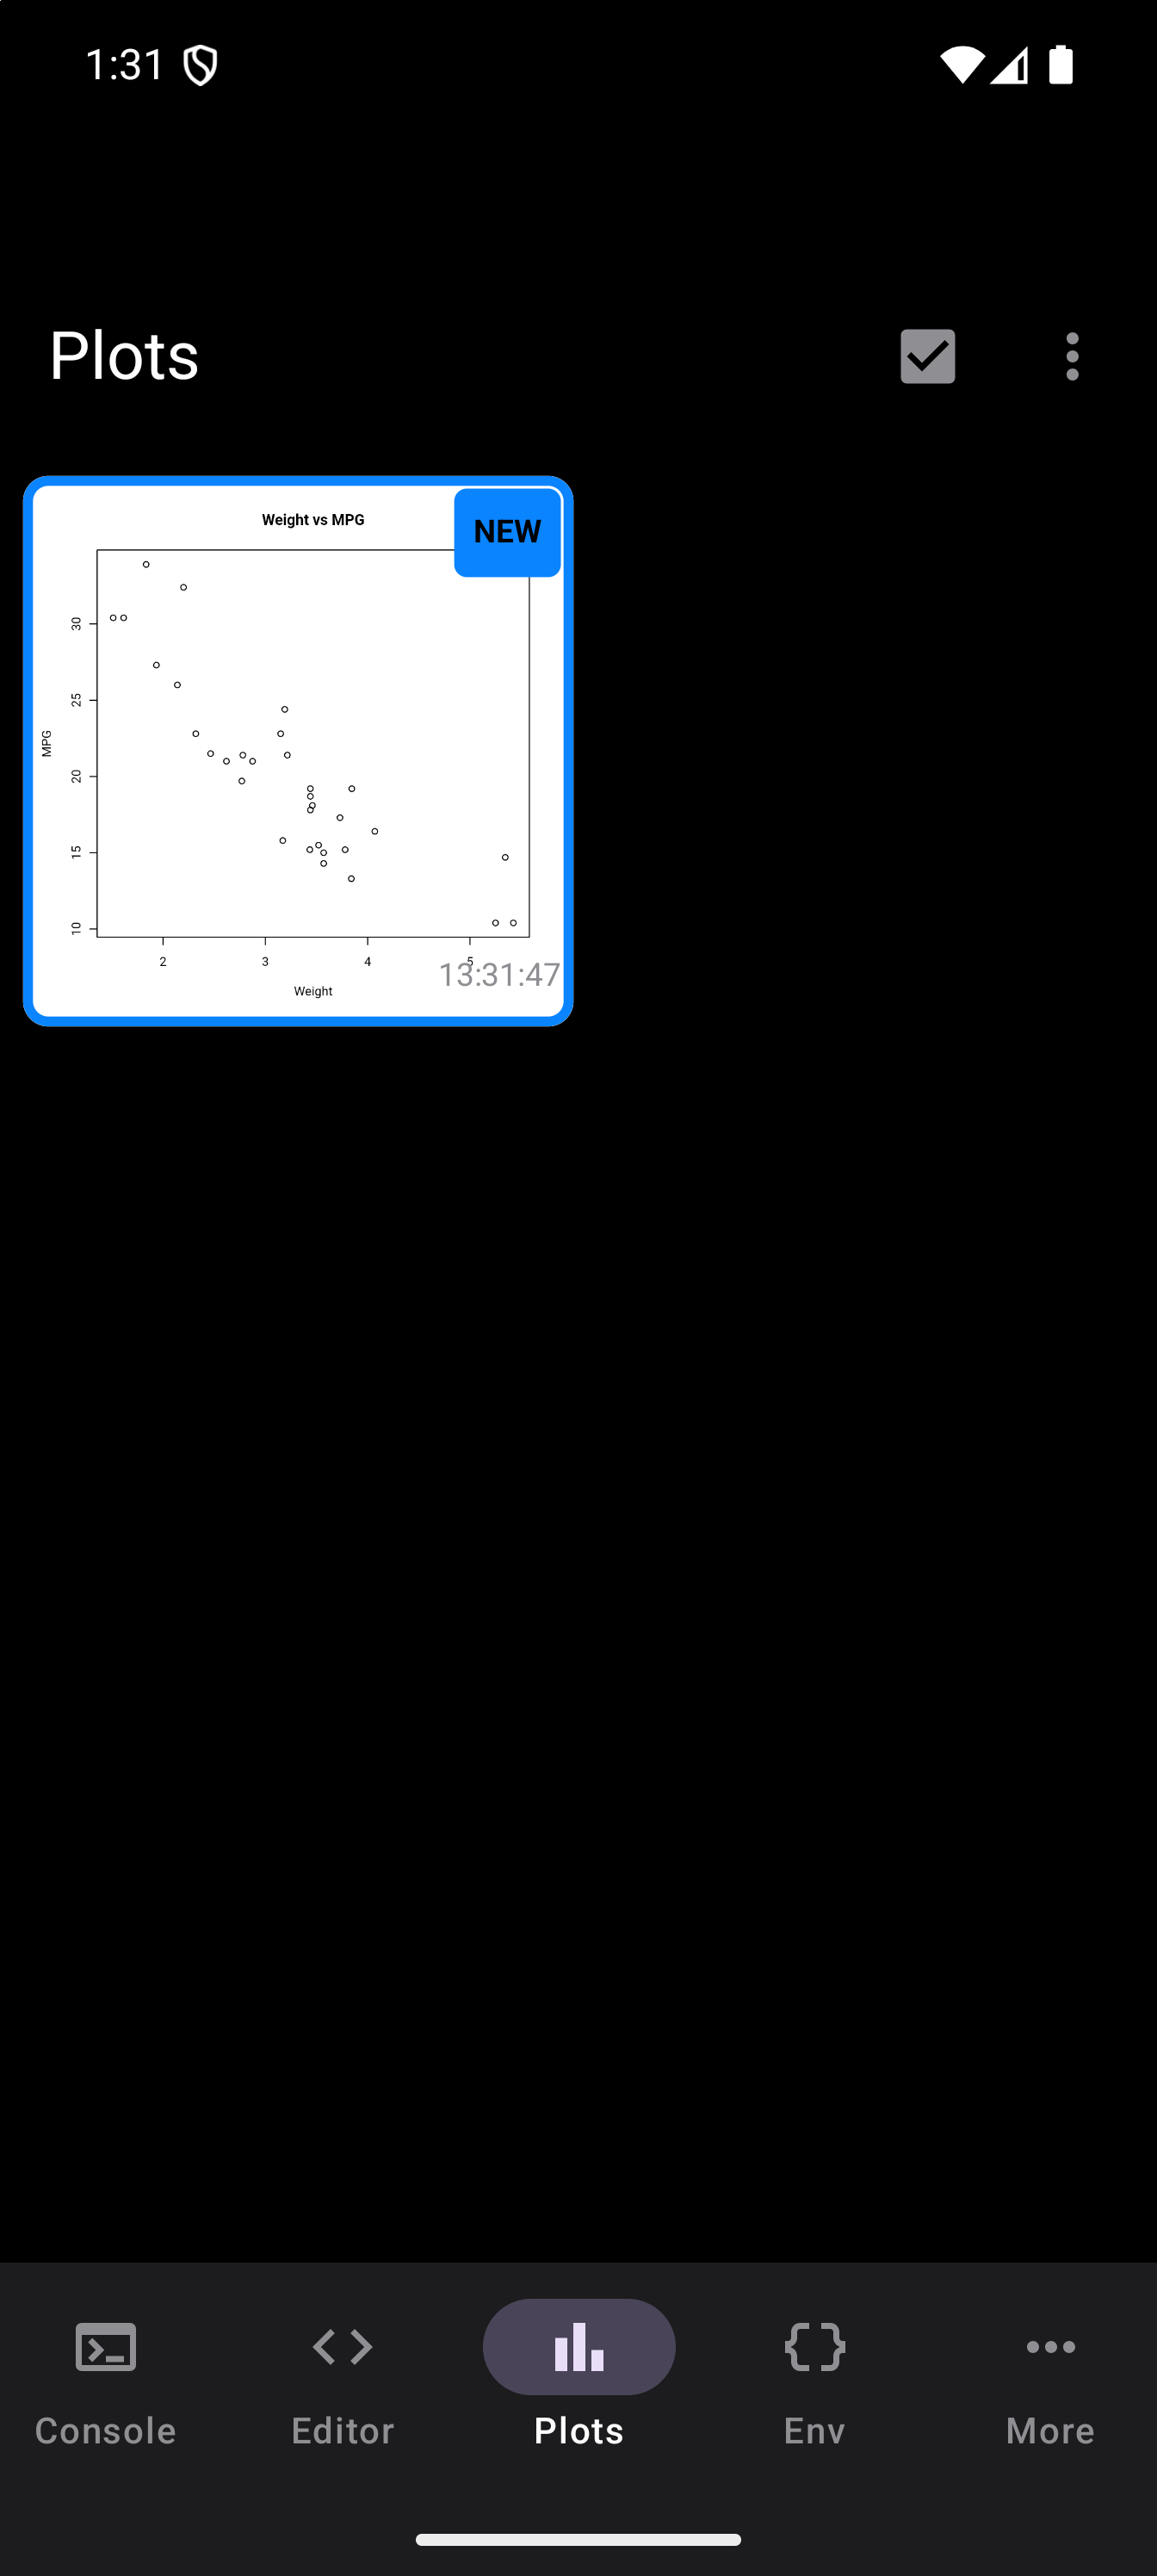
From the gallery you can tap any thumbnail to view it full-screen, pinch to zoom, and export or share it. See the Plots guide for details on comparison mode, display modes, and more.
Checking Your Workspace
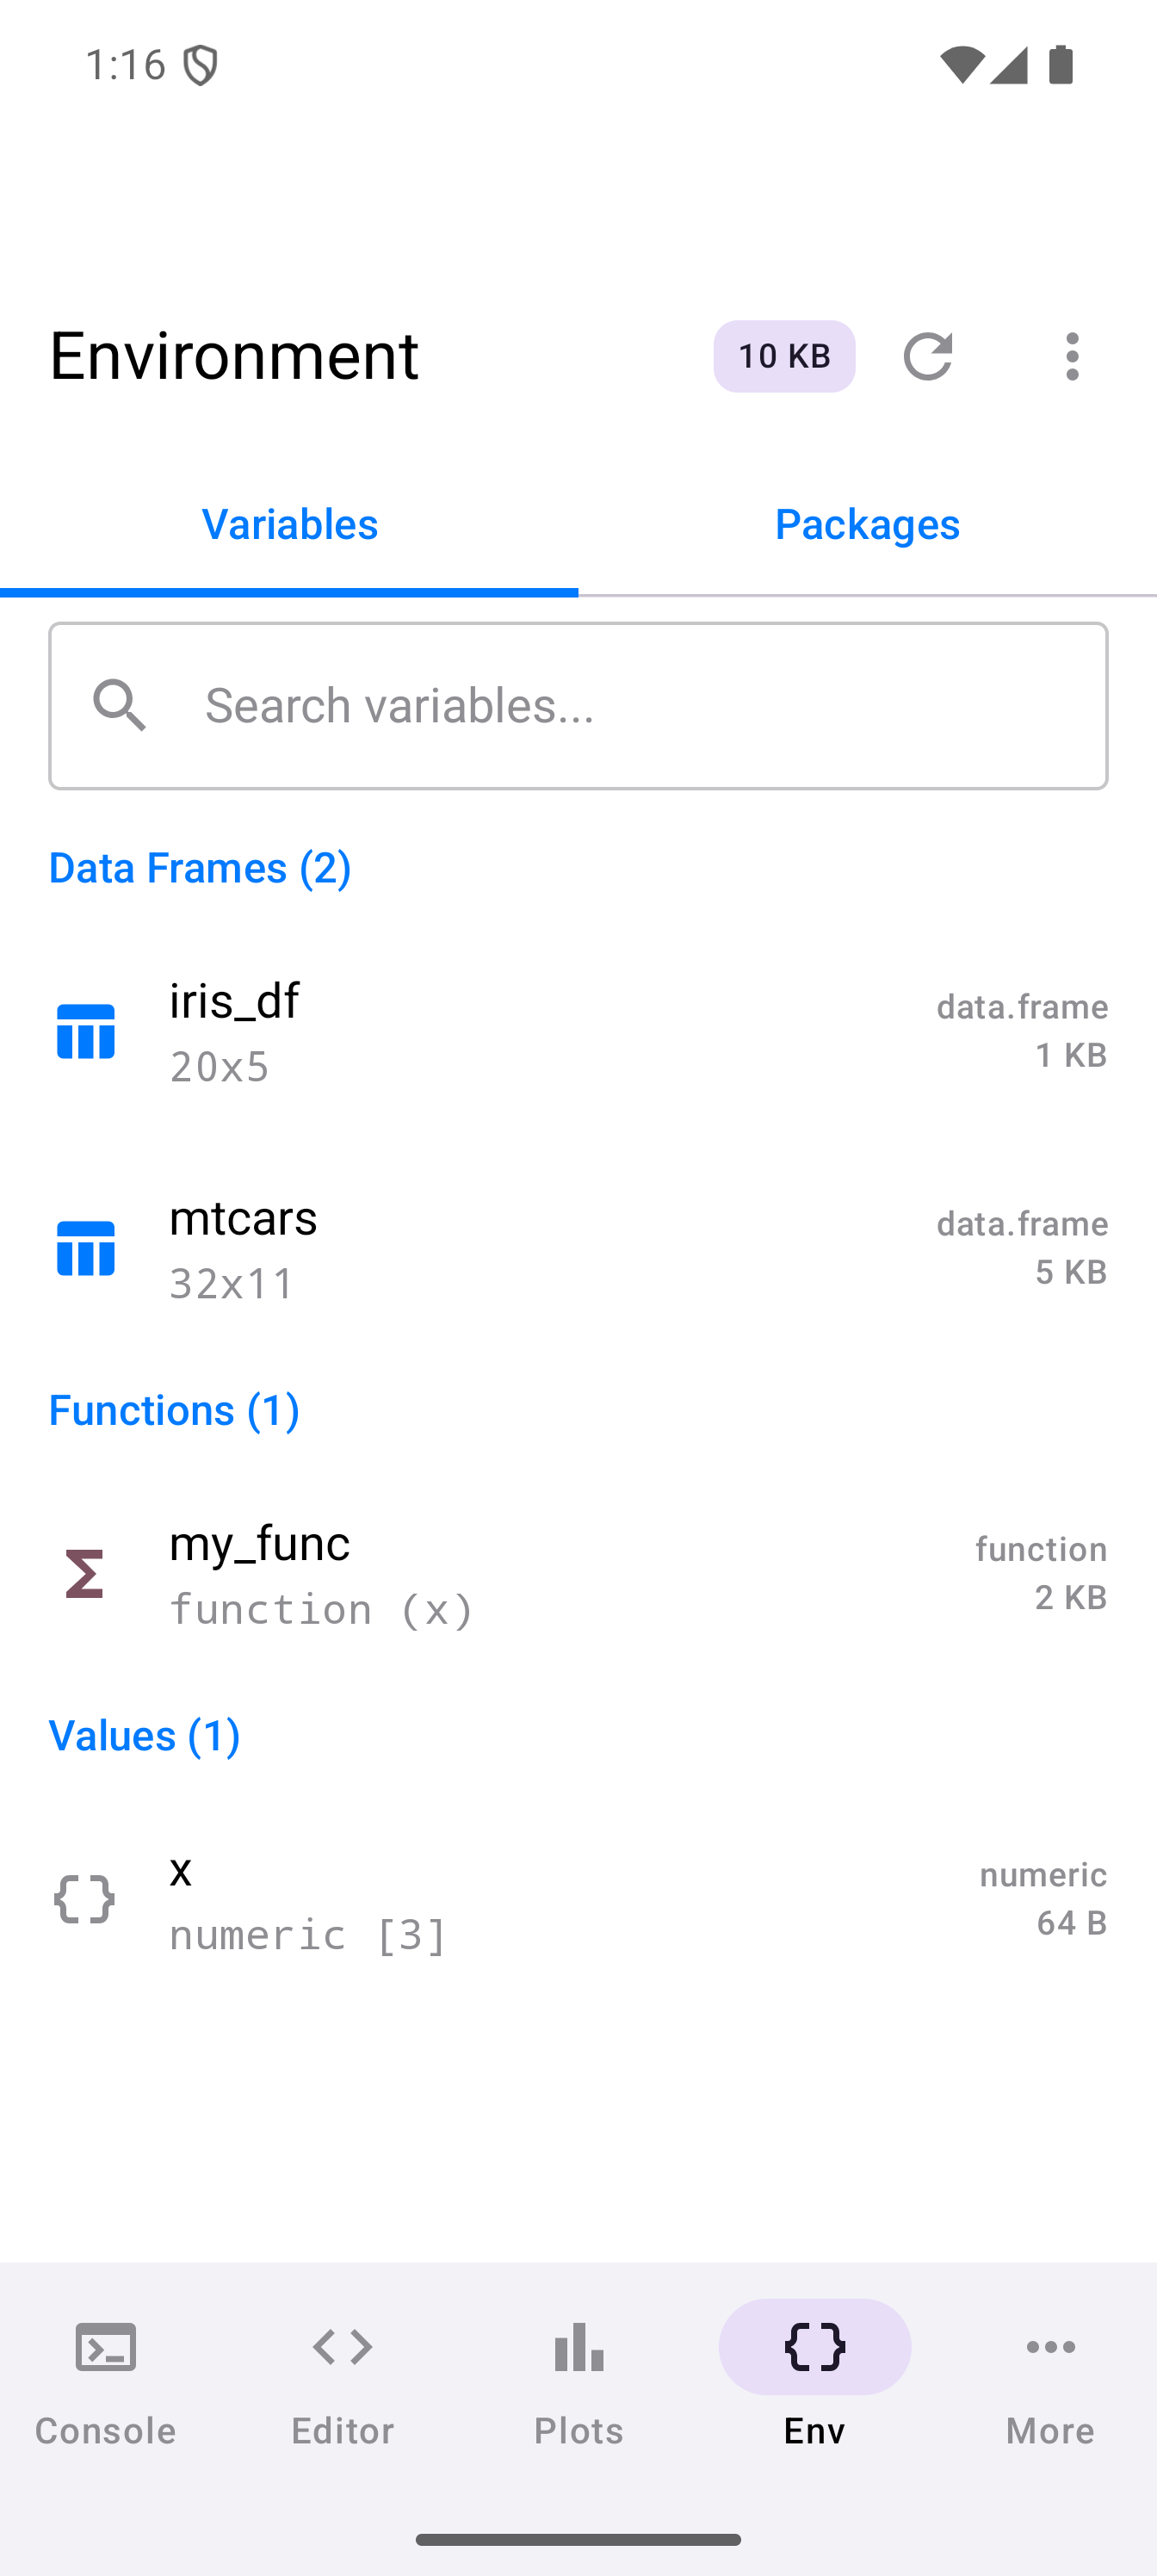
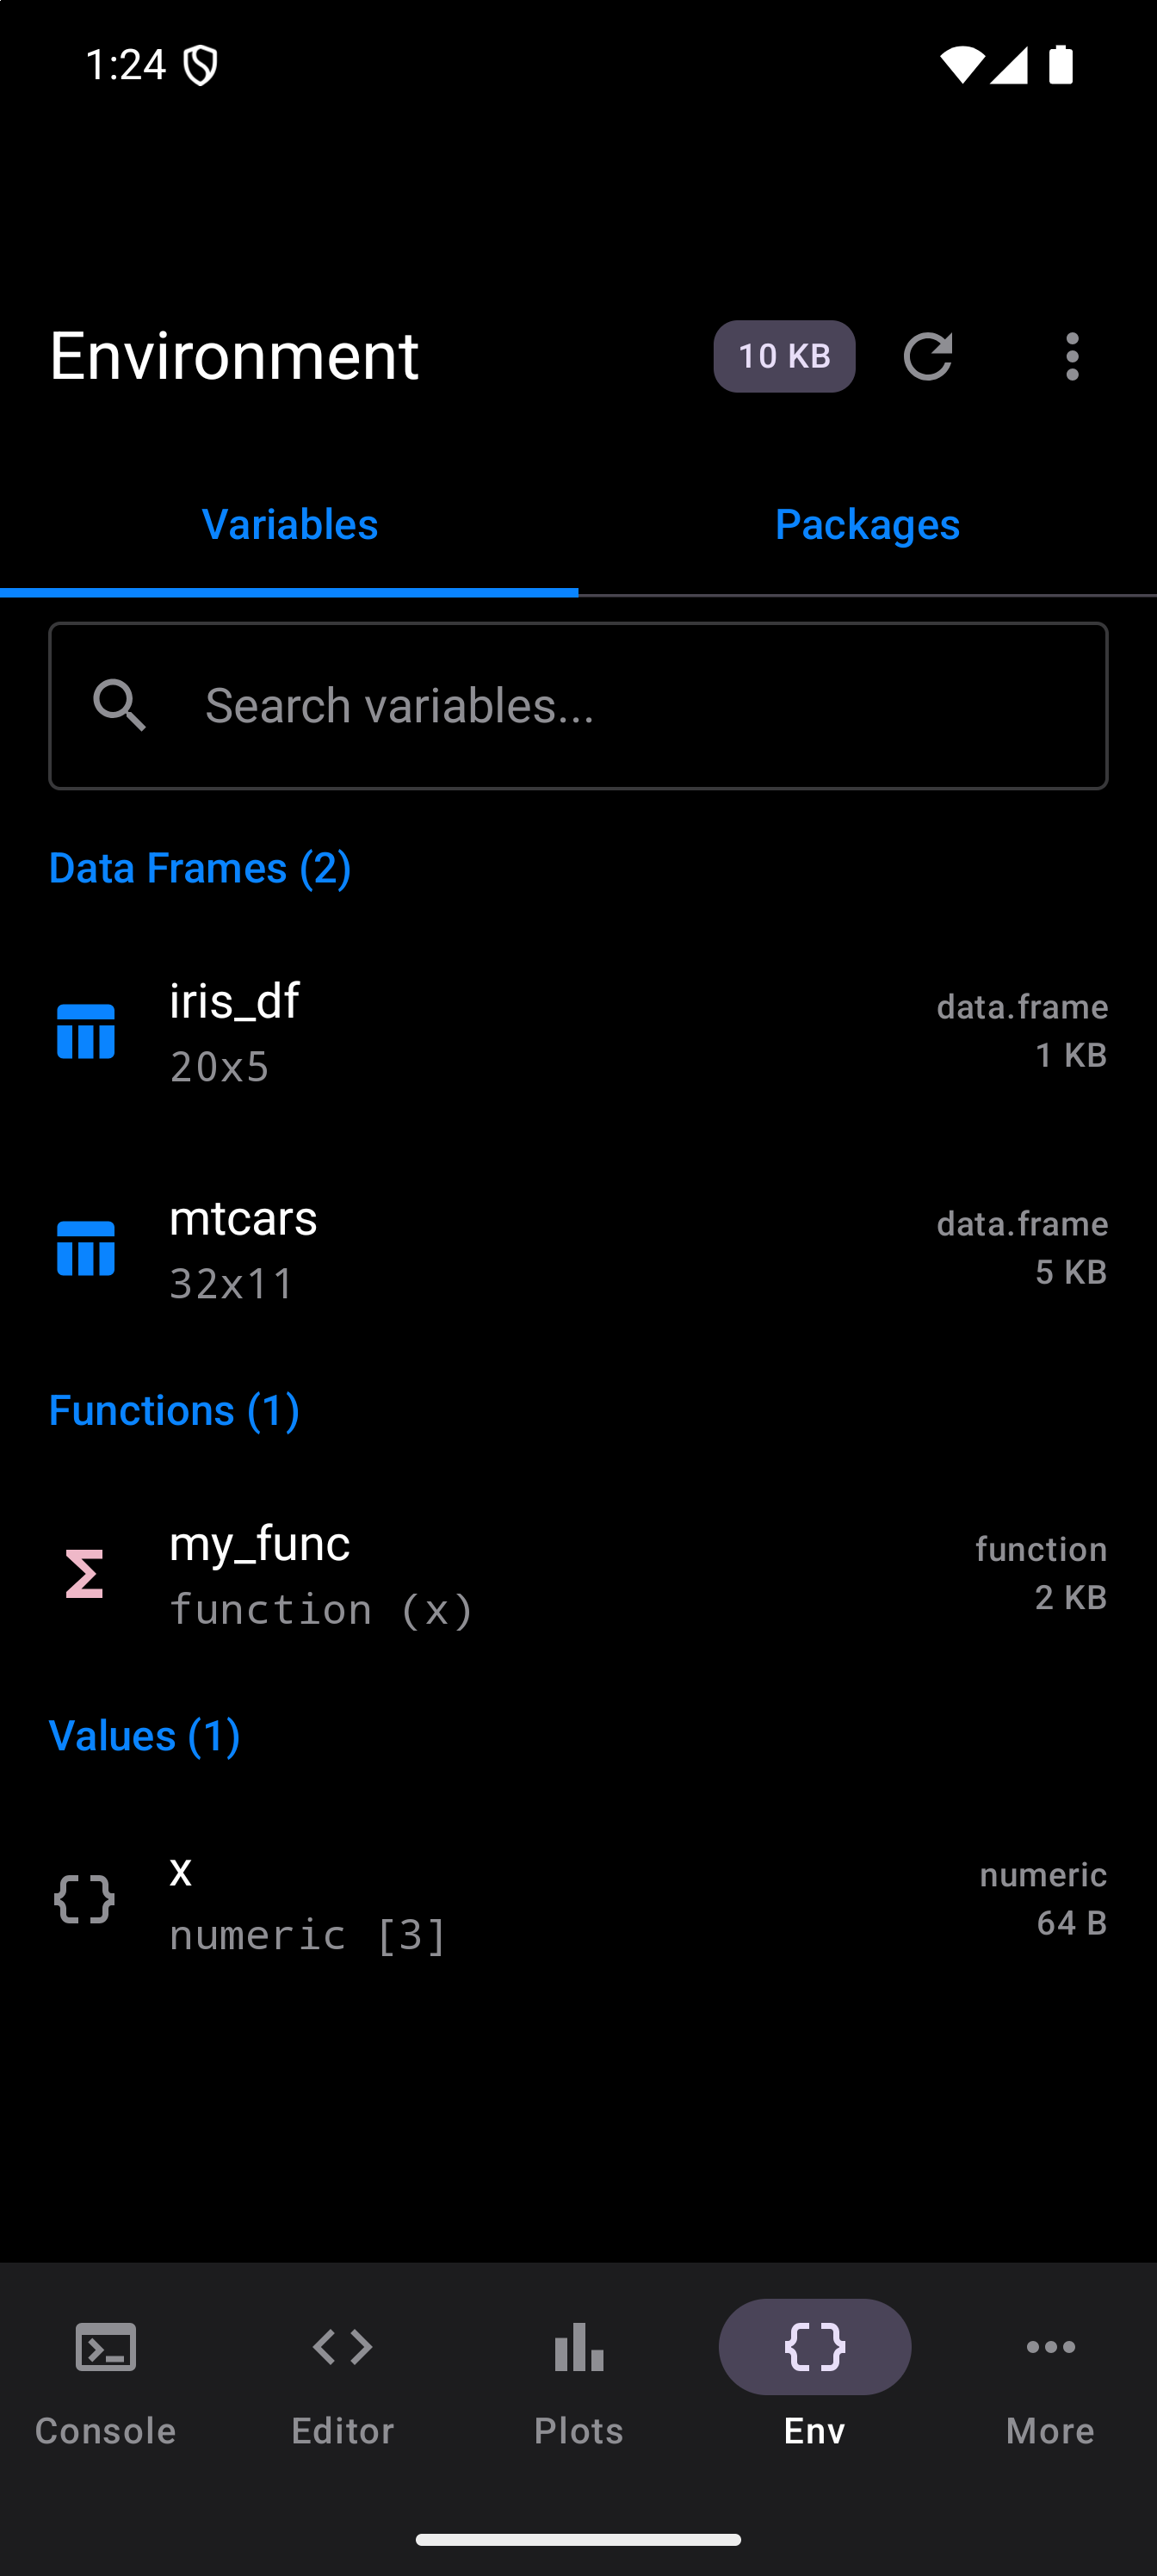
After running some commands, switch to the Environment screen (the Env tab at the bottom on a phone) to see the variables you have created. Variables are grouped by type (Data Frames, Matrices, Lists, Functions, Values) and each entry shows a brief summary of its contents. A memory usage badge at the top tells you how much of the R session’s memory is in use.
You can search for specific variables using the search bar, and switch between the Variables and Packages sub-tabs.
If you have followed along, your list has one entry so far: x, under Values. The screenshot below comes from a workspace with a few more things in it: two data frames called iris_df and mtcars, and a function called my_func. To make your list match, run these in the Console too:
iris_df <- head(iris, 20)
my_func <- function(x) { mean(x) }
mtcars <- datasets::mtcars
The last line makes your own copy of mtcars, one of the example data sets that come with R. The list shows only what you have made yourself, so mtcars stays out of it until you run that line, even though you used it for the plot above.
Layout Modes
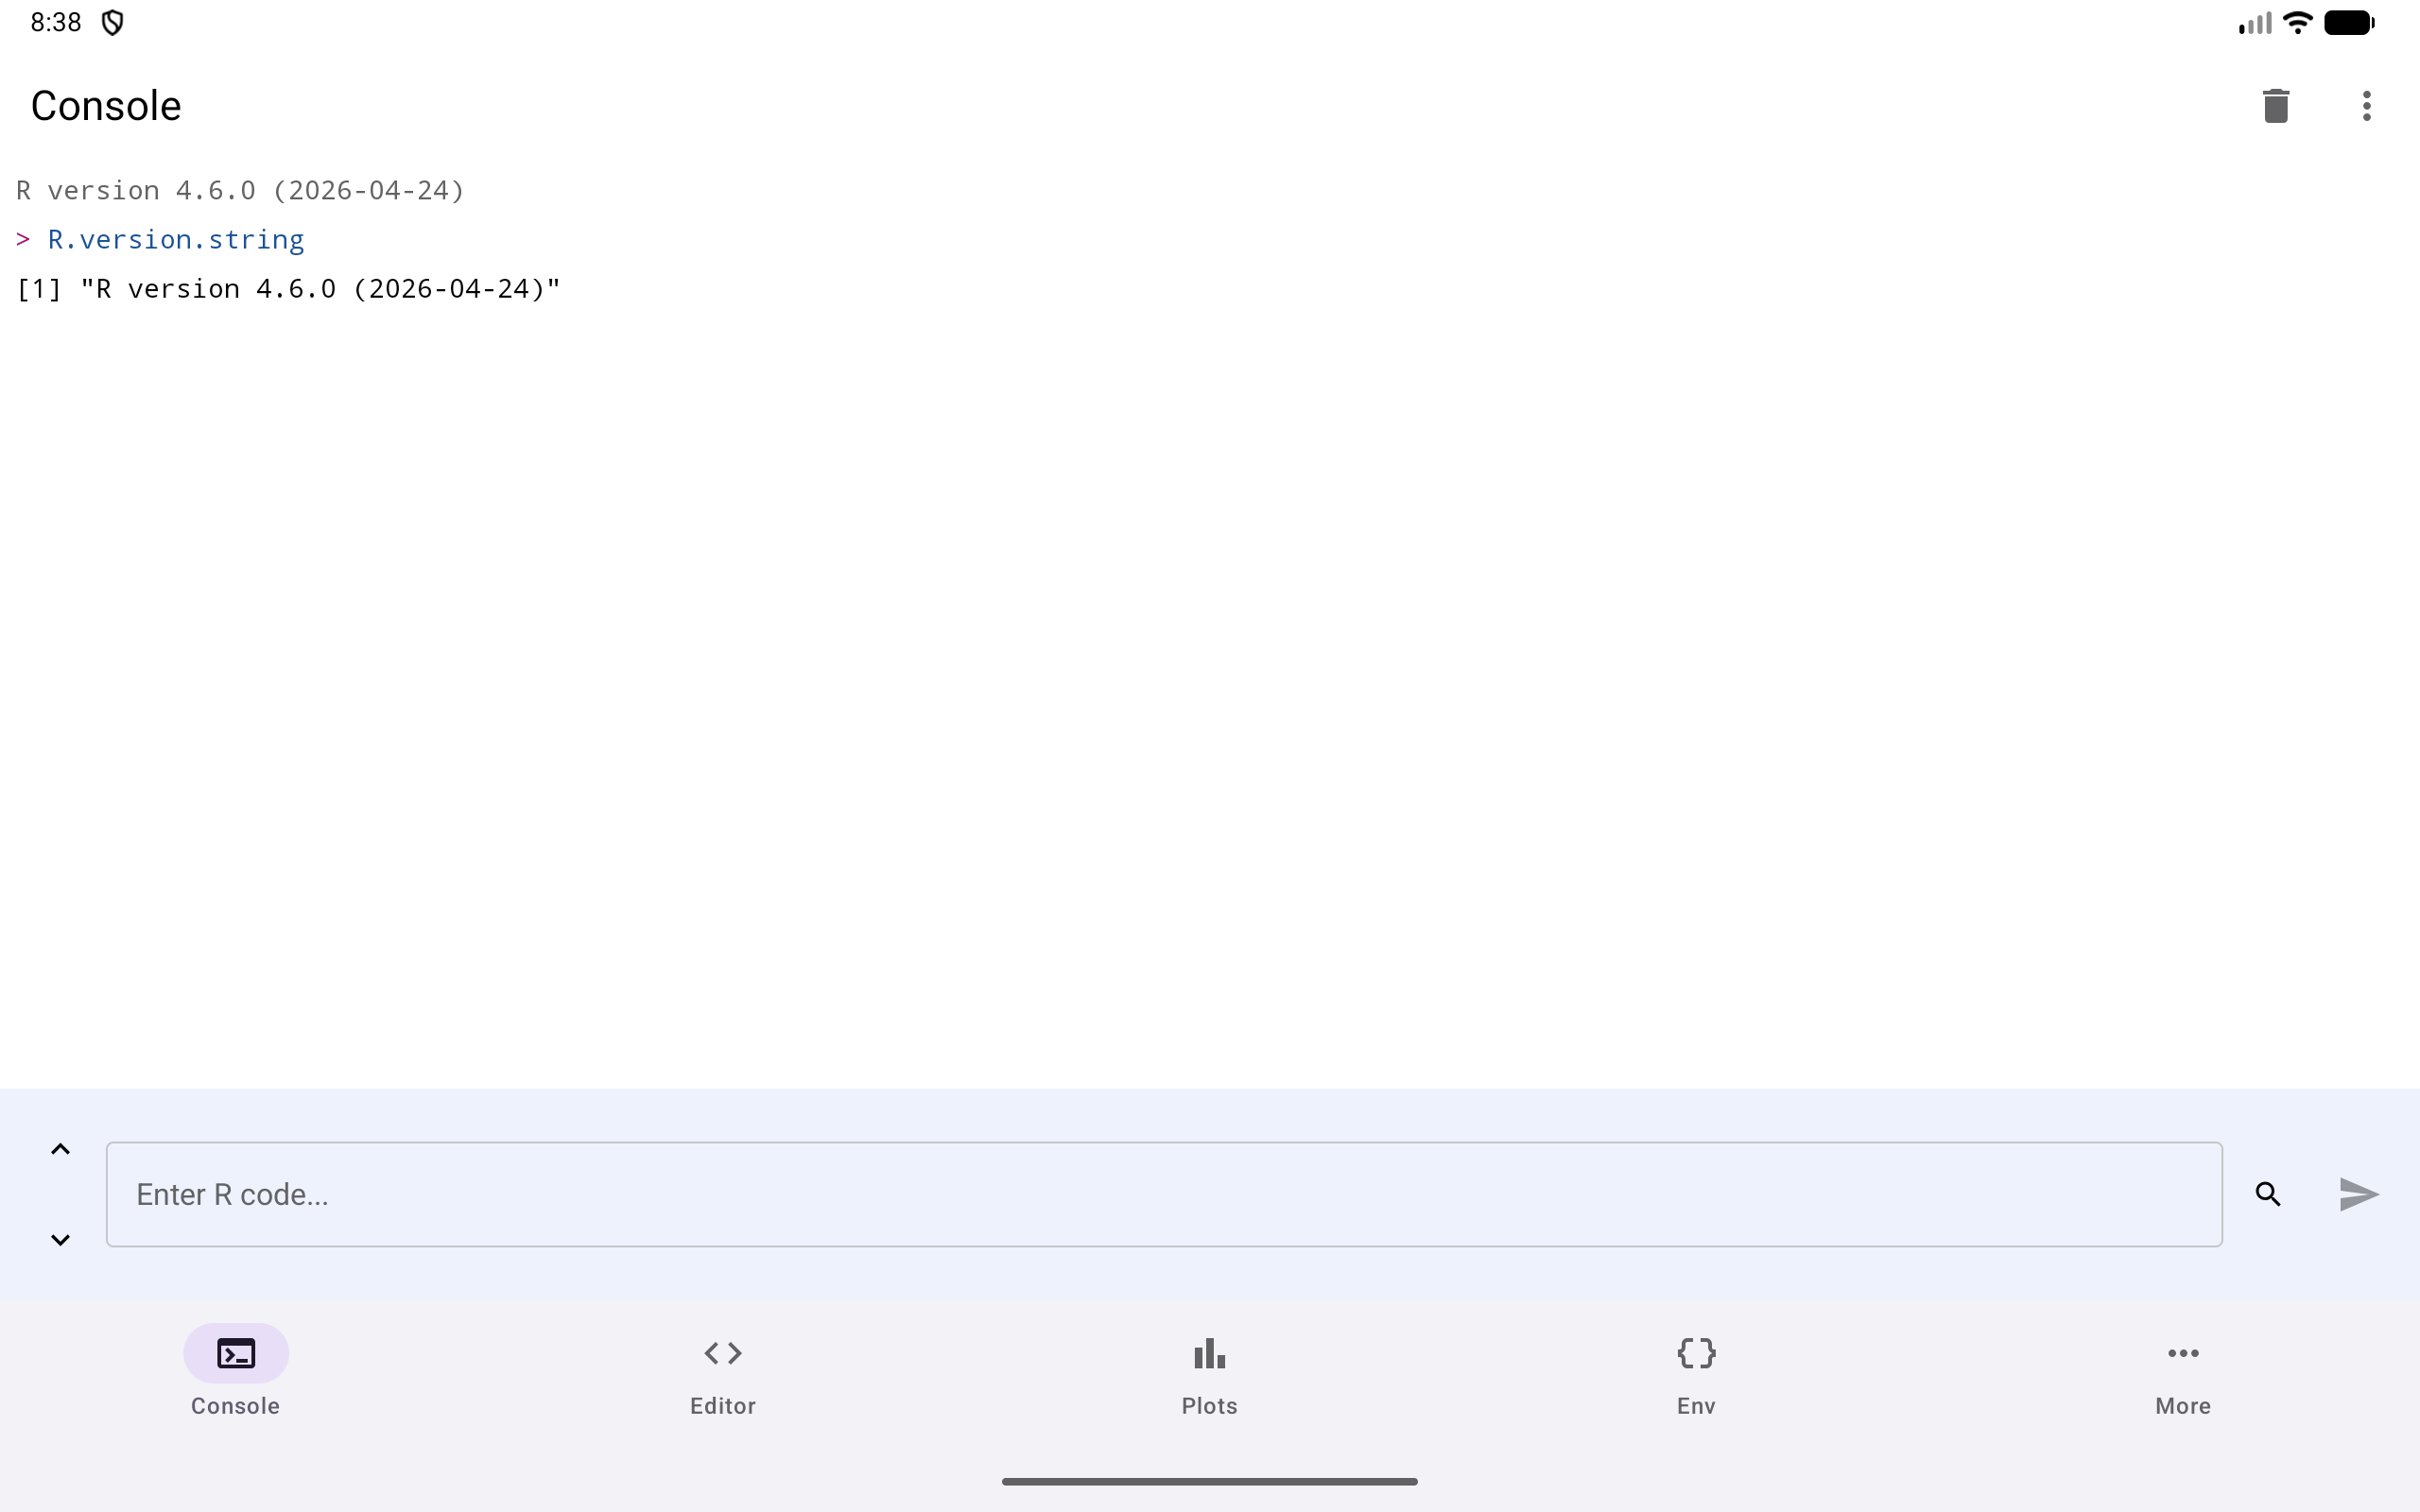
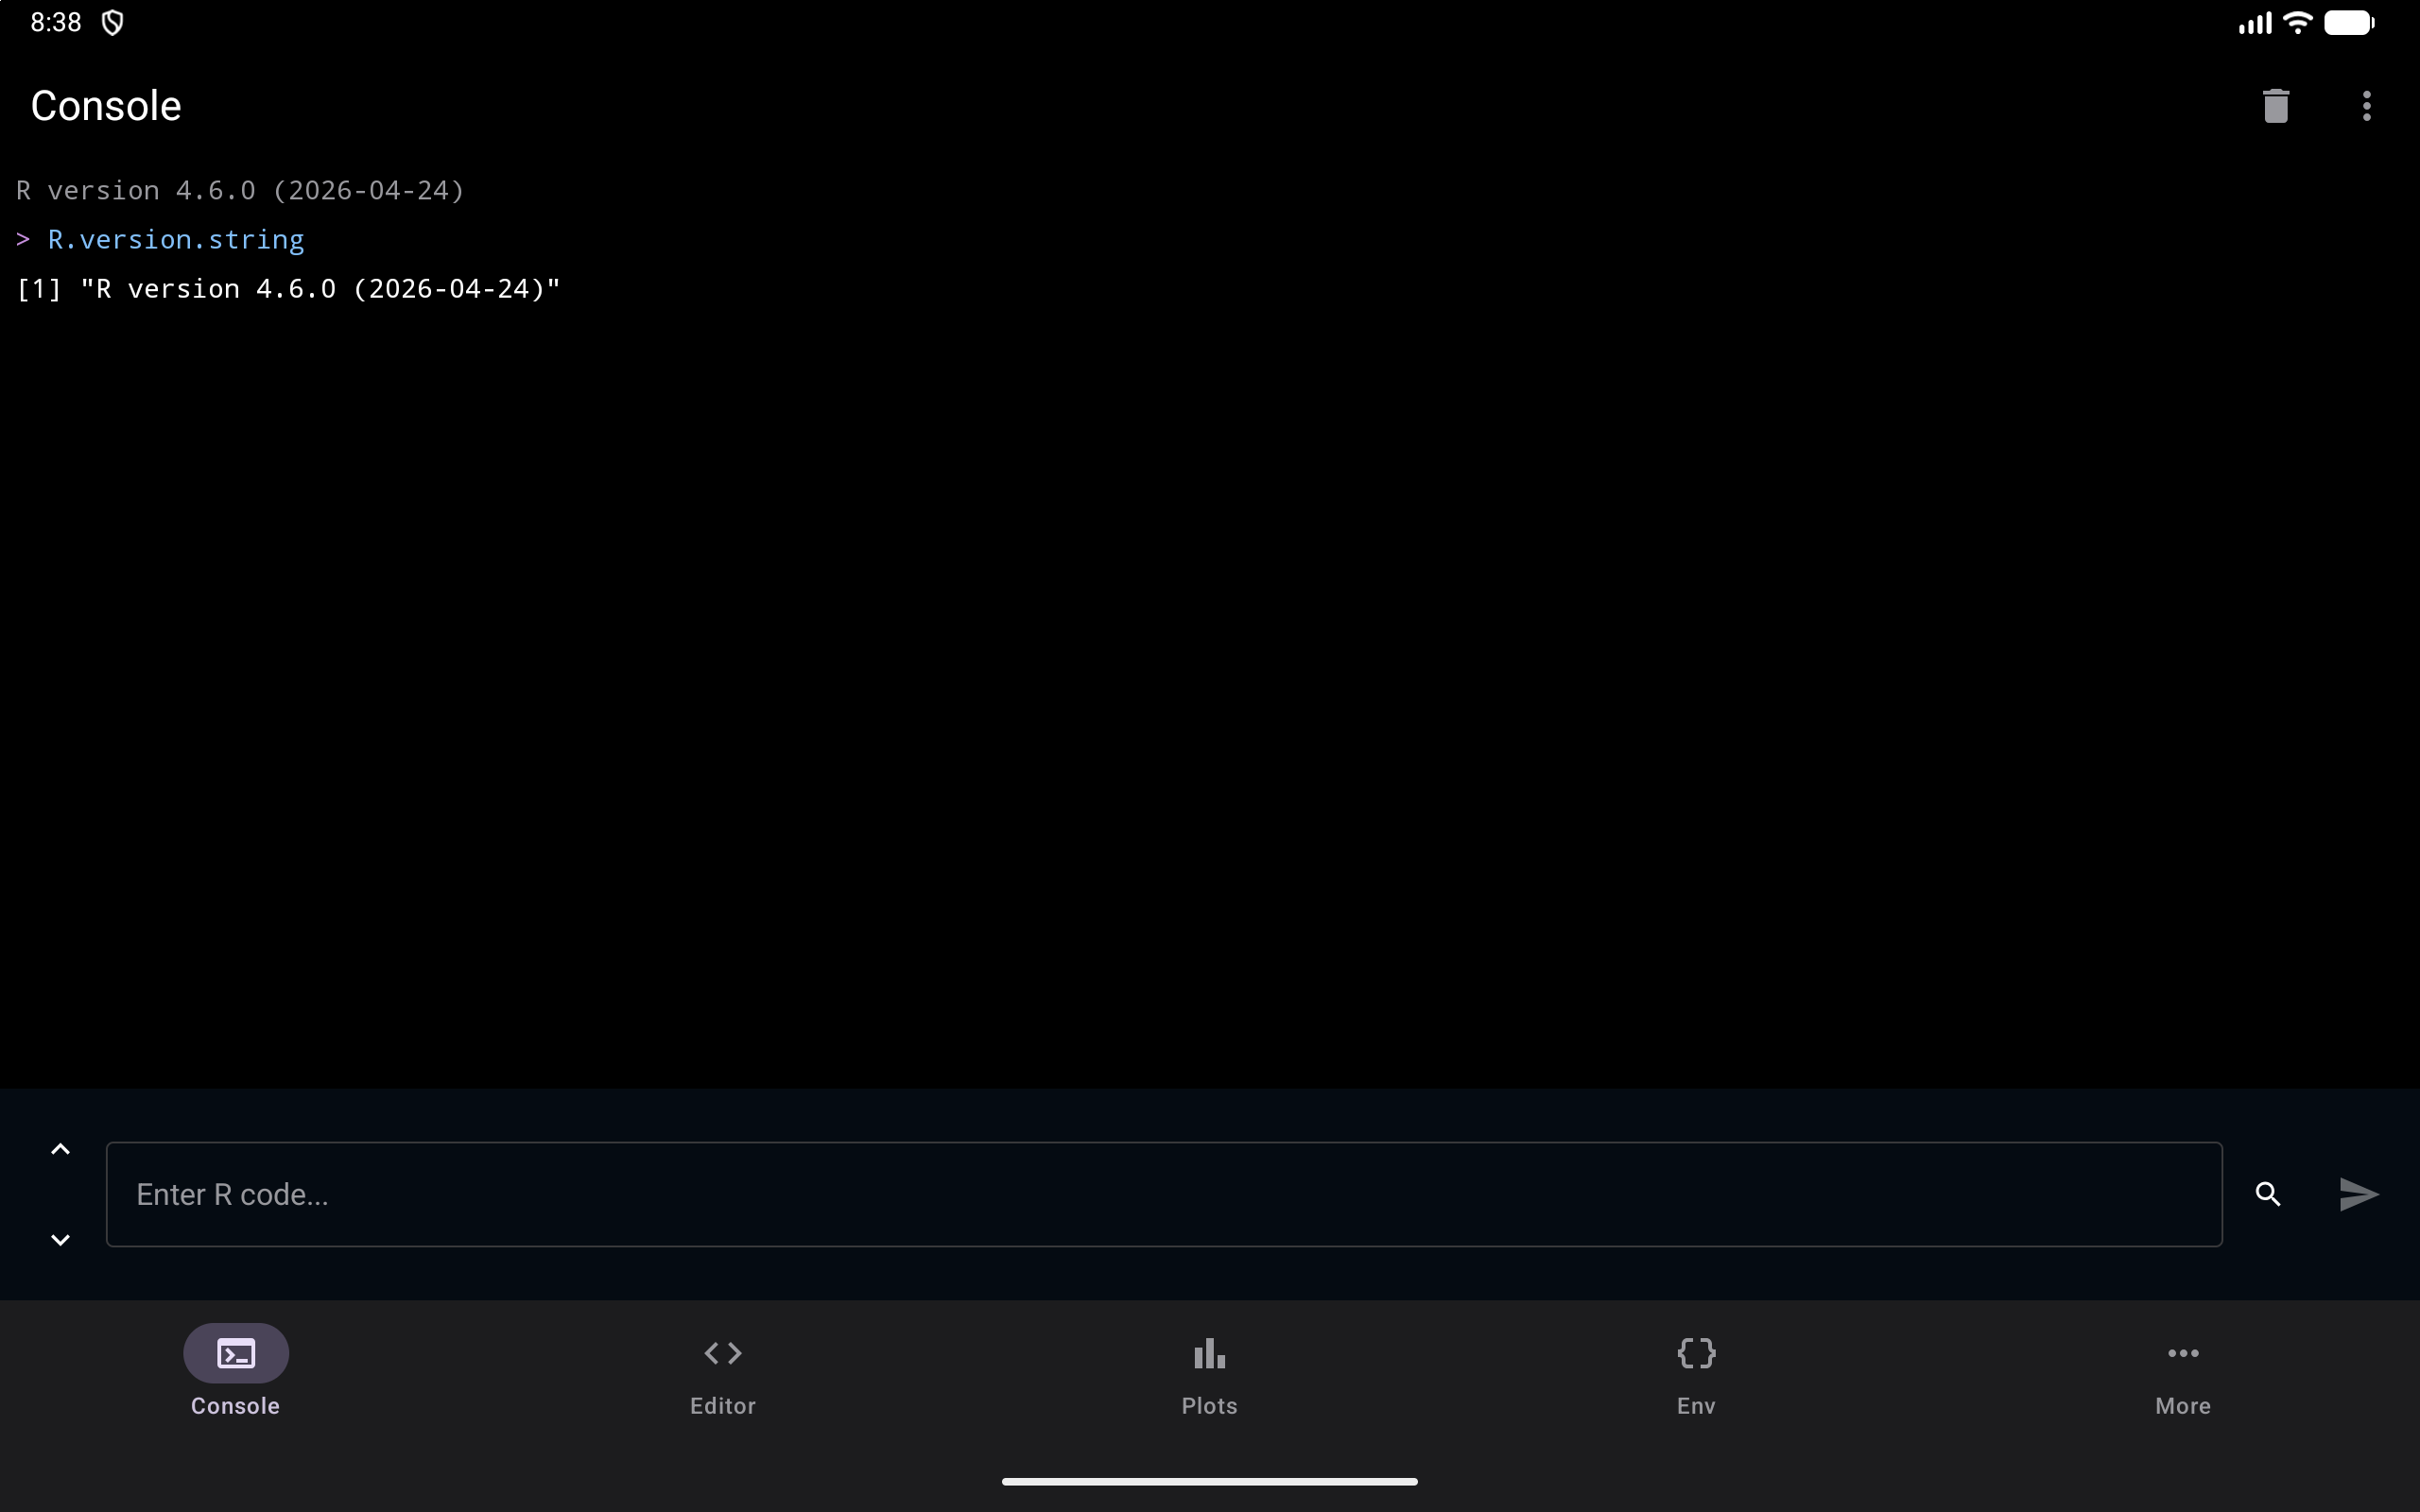
webRoid offers three layout modes, which you can change in Settings:
- Tab Bar (default on phones)
- The standard bottom navigation. Best for phones. One screen at a time, switch between tabs.
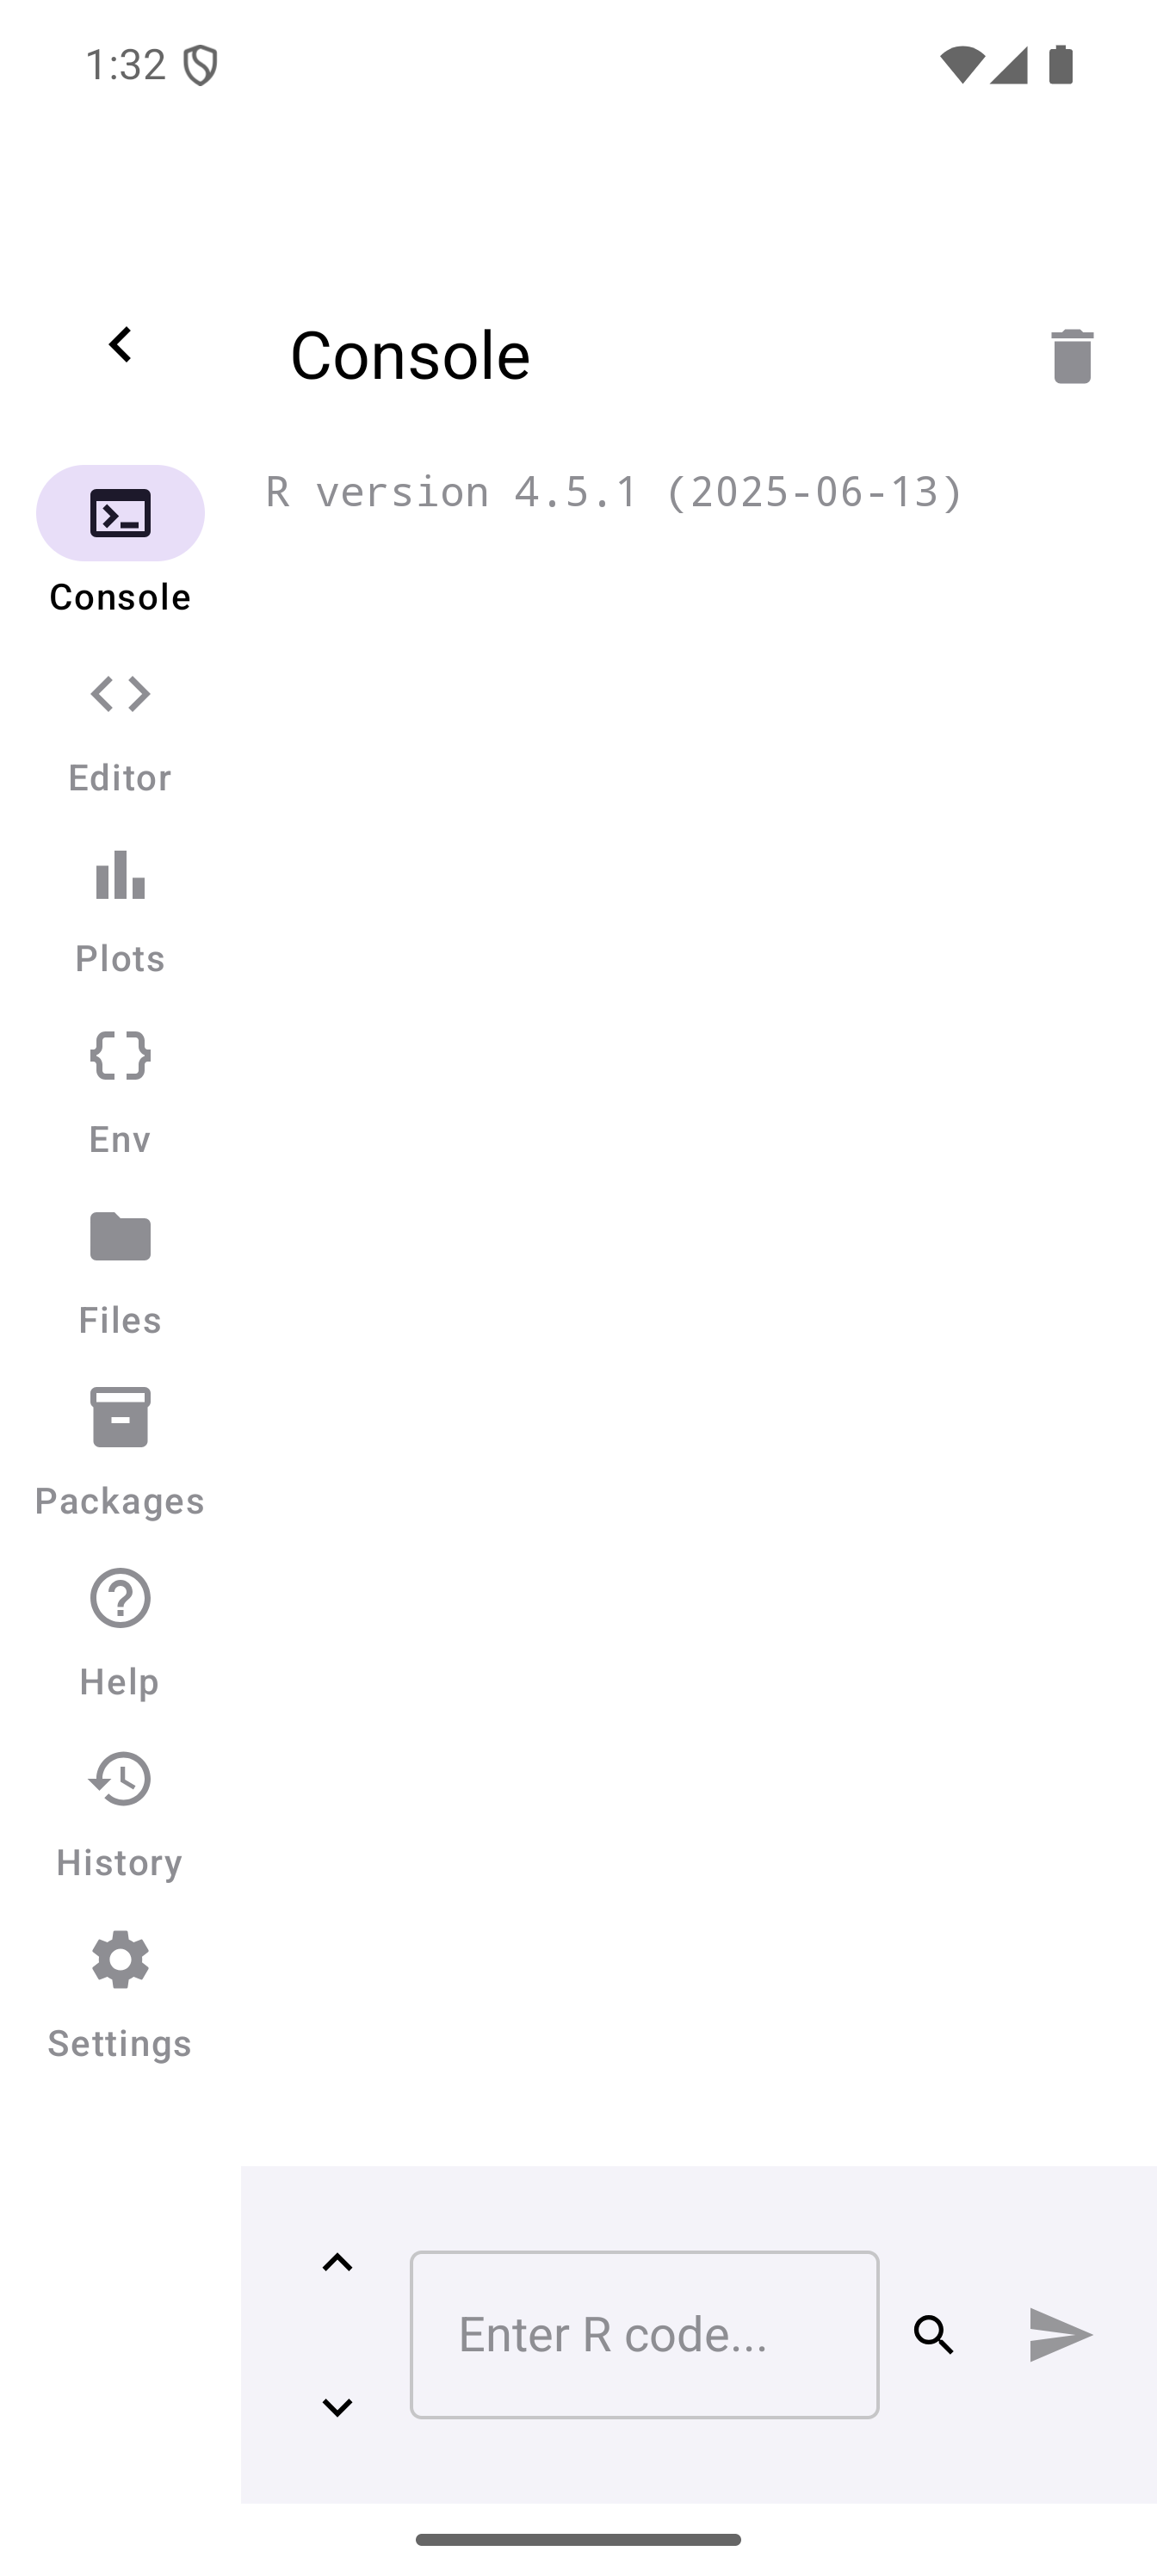
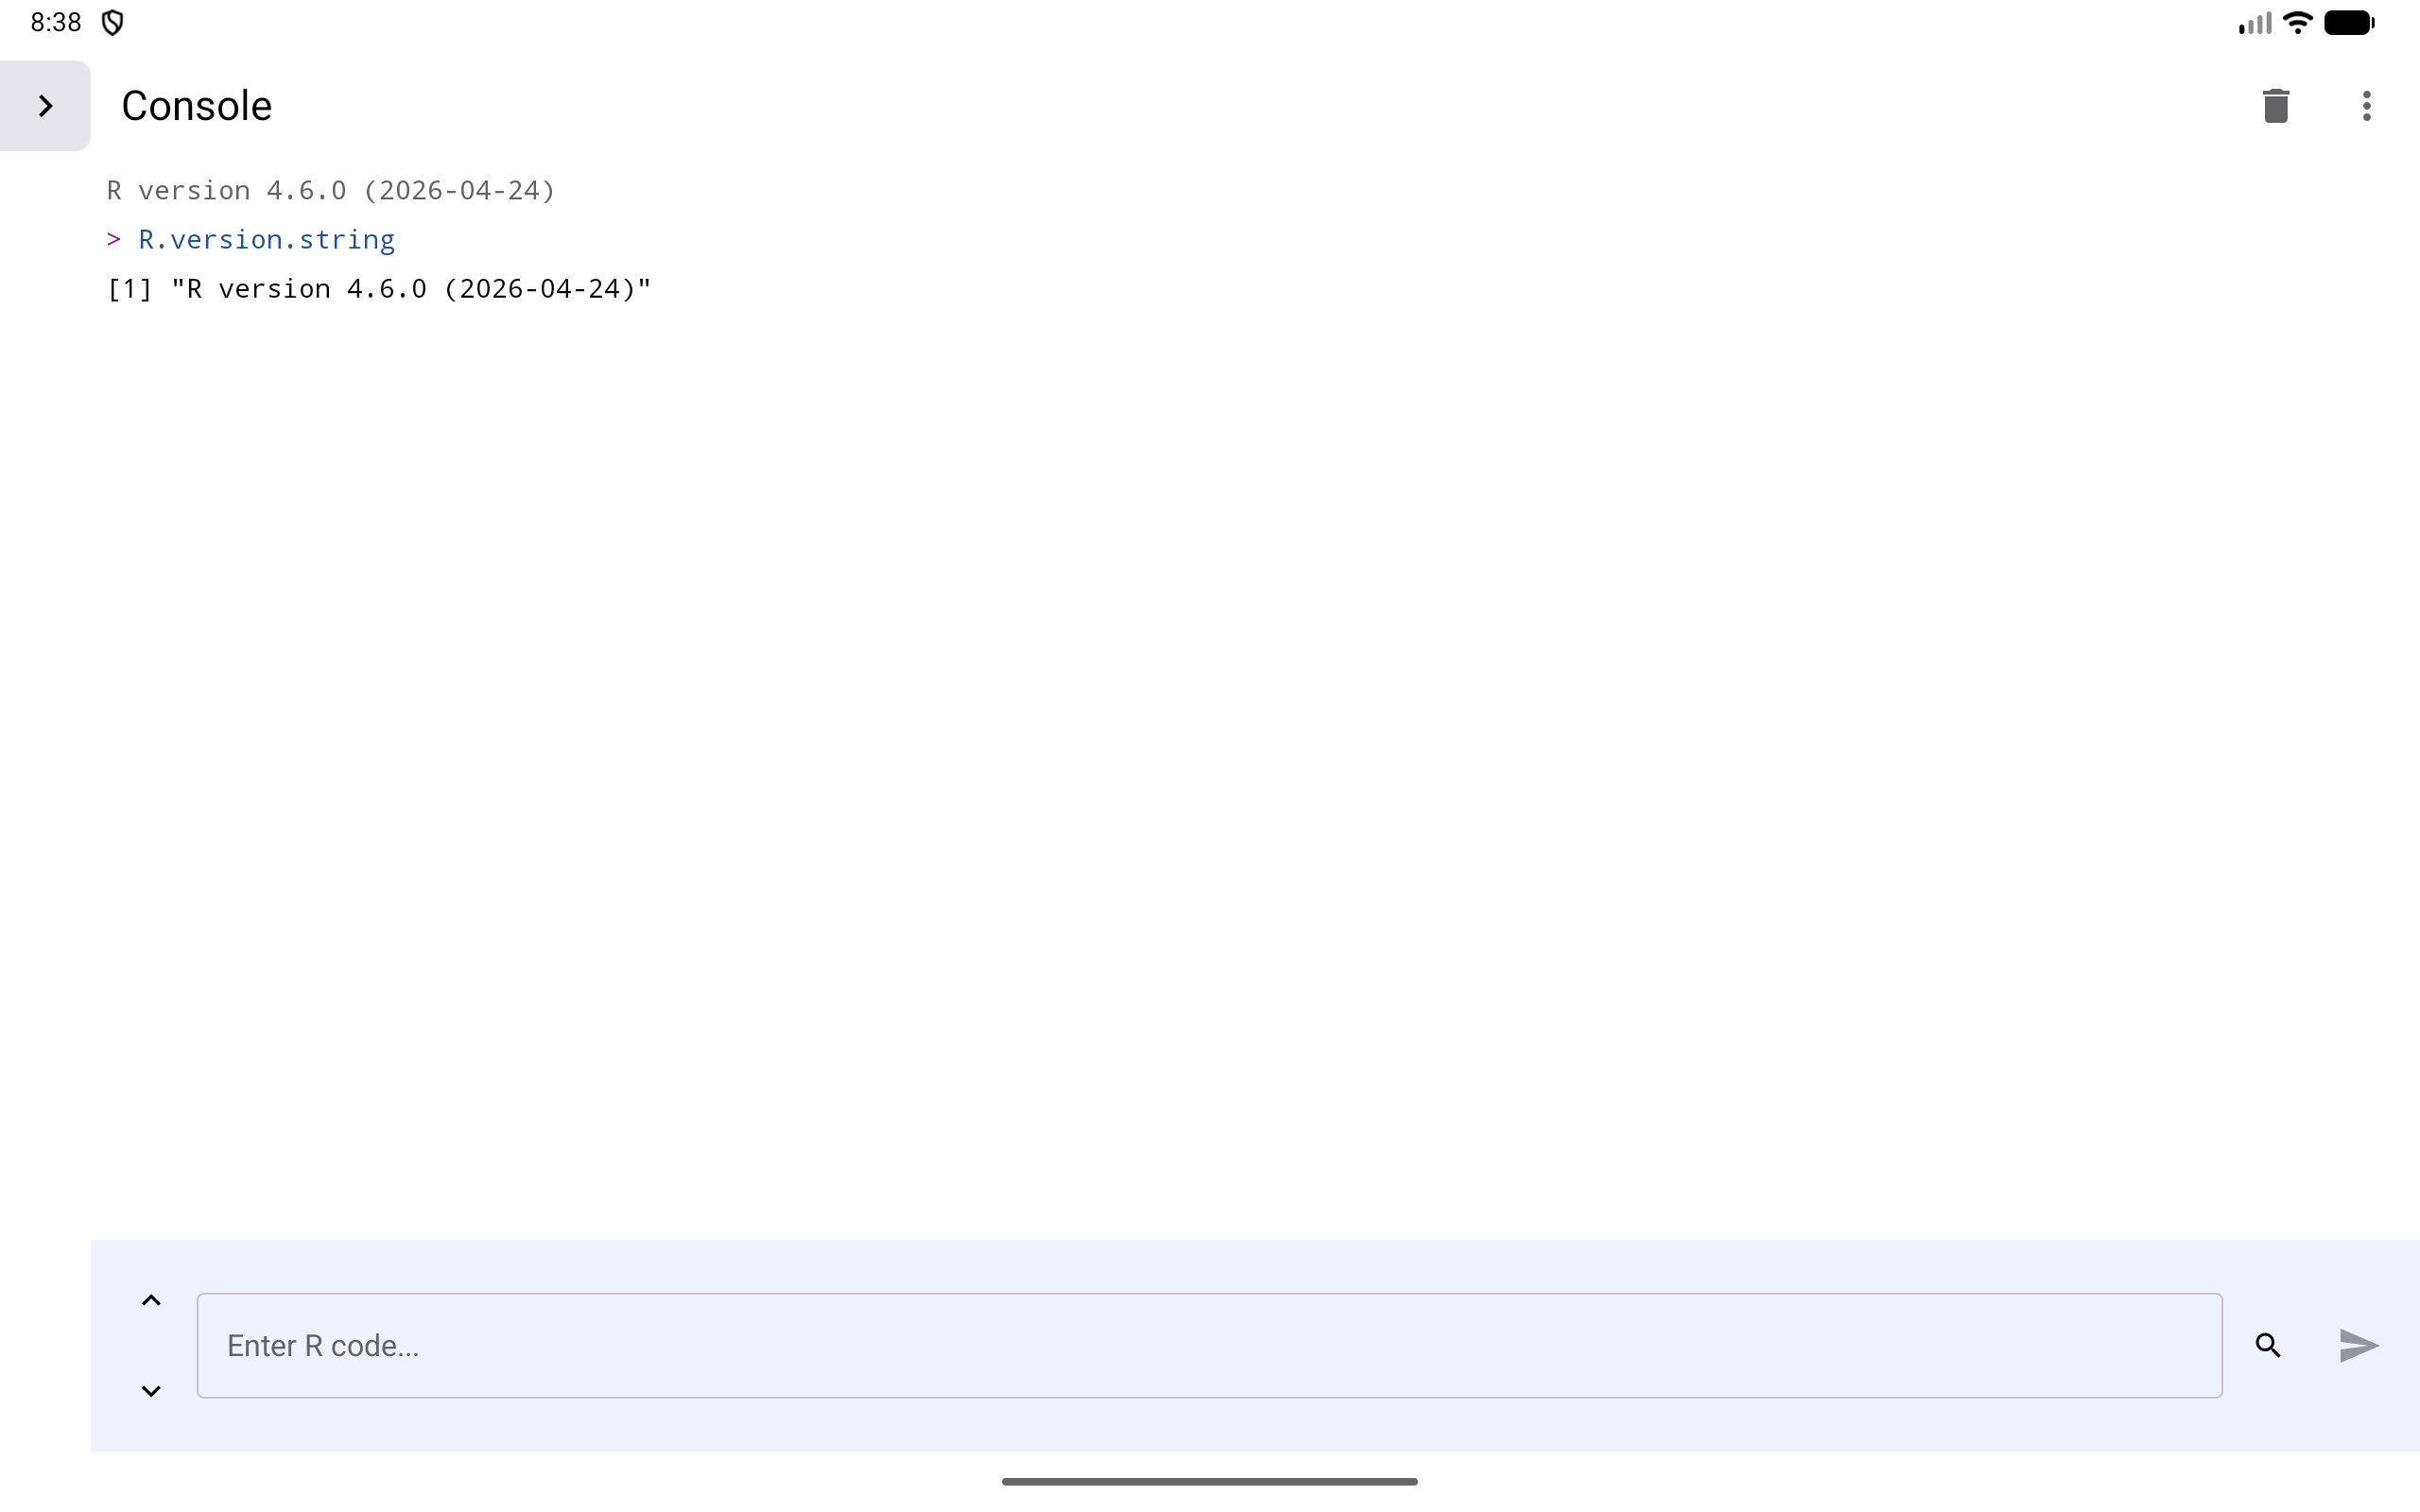
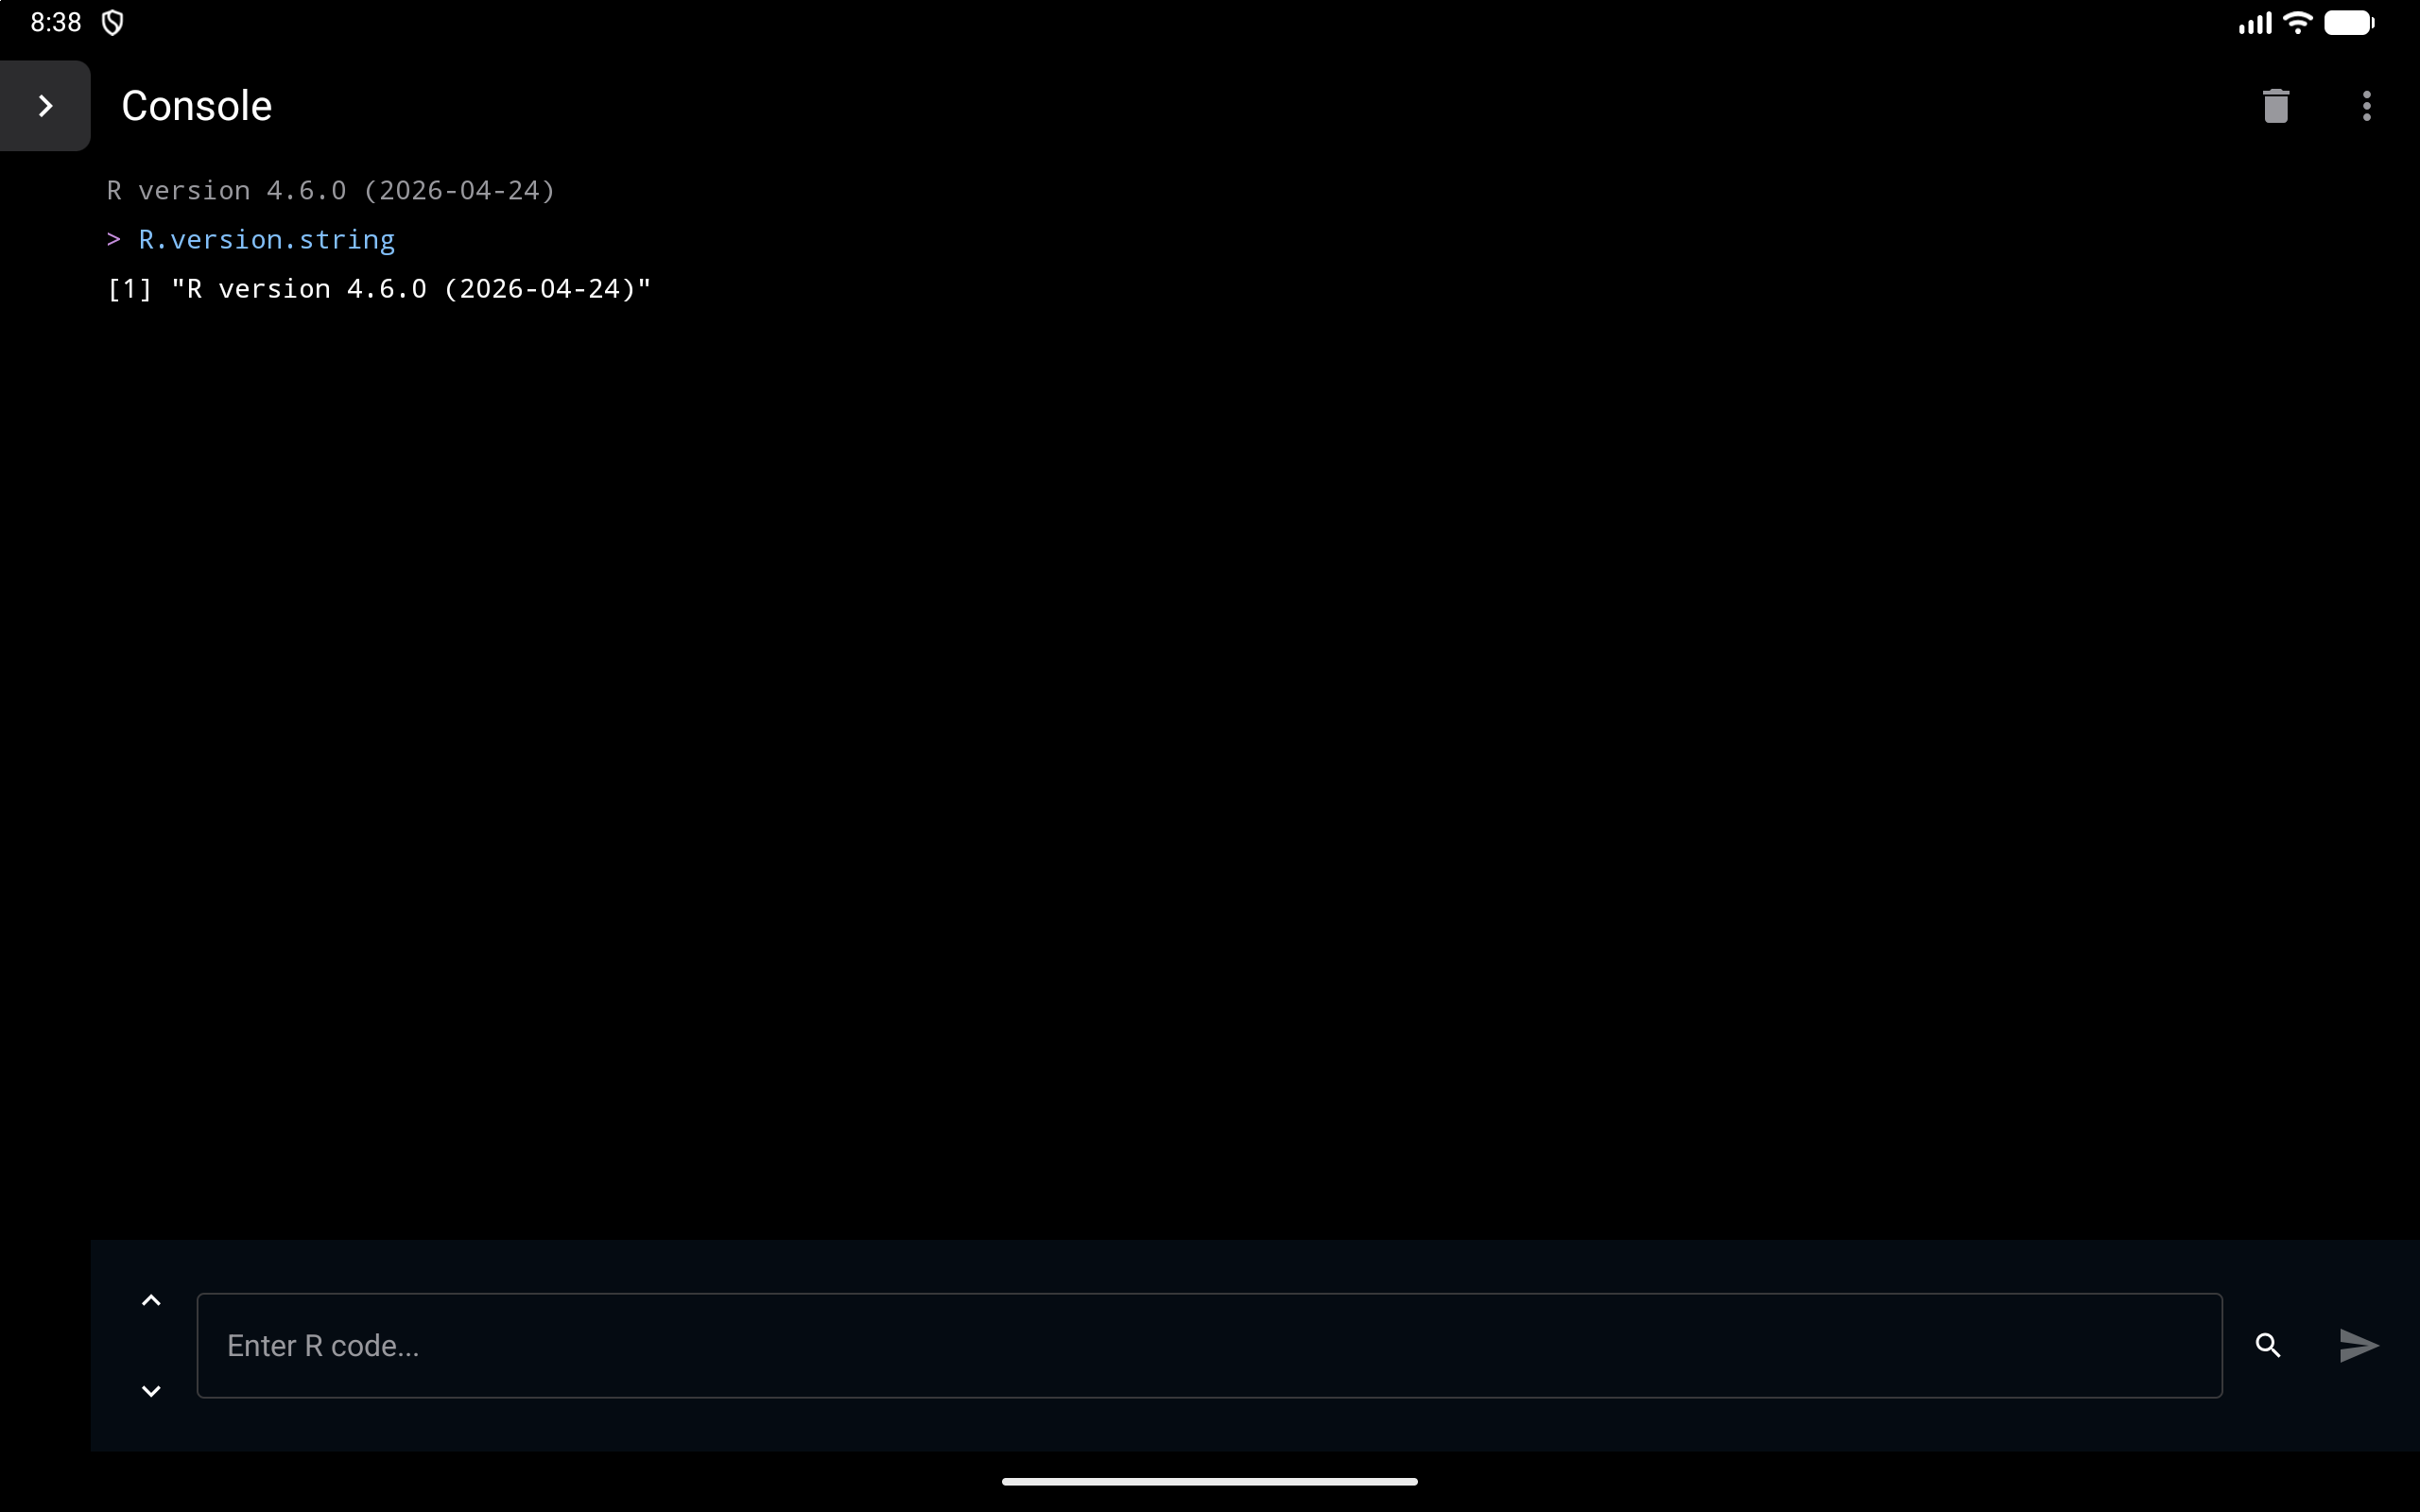
- Sidebar
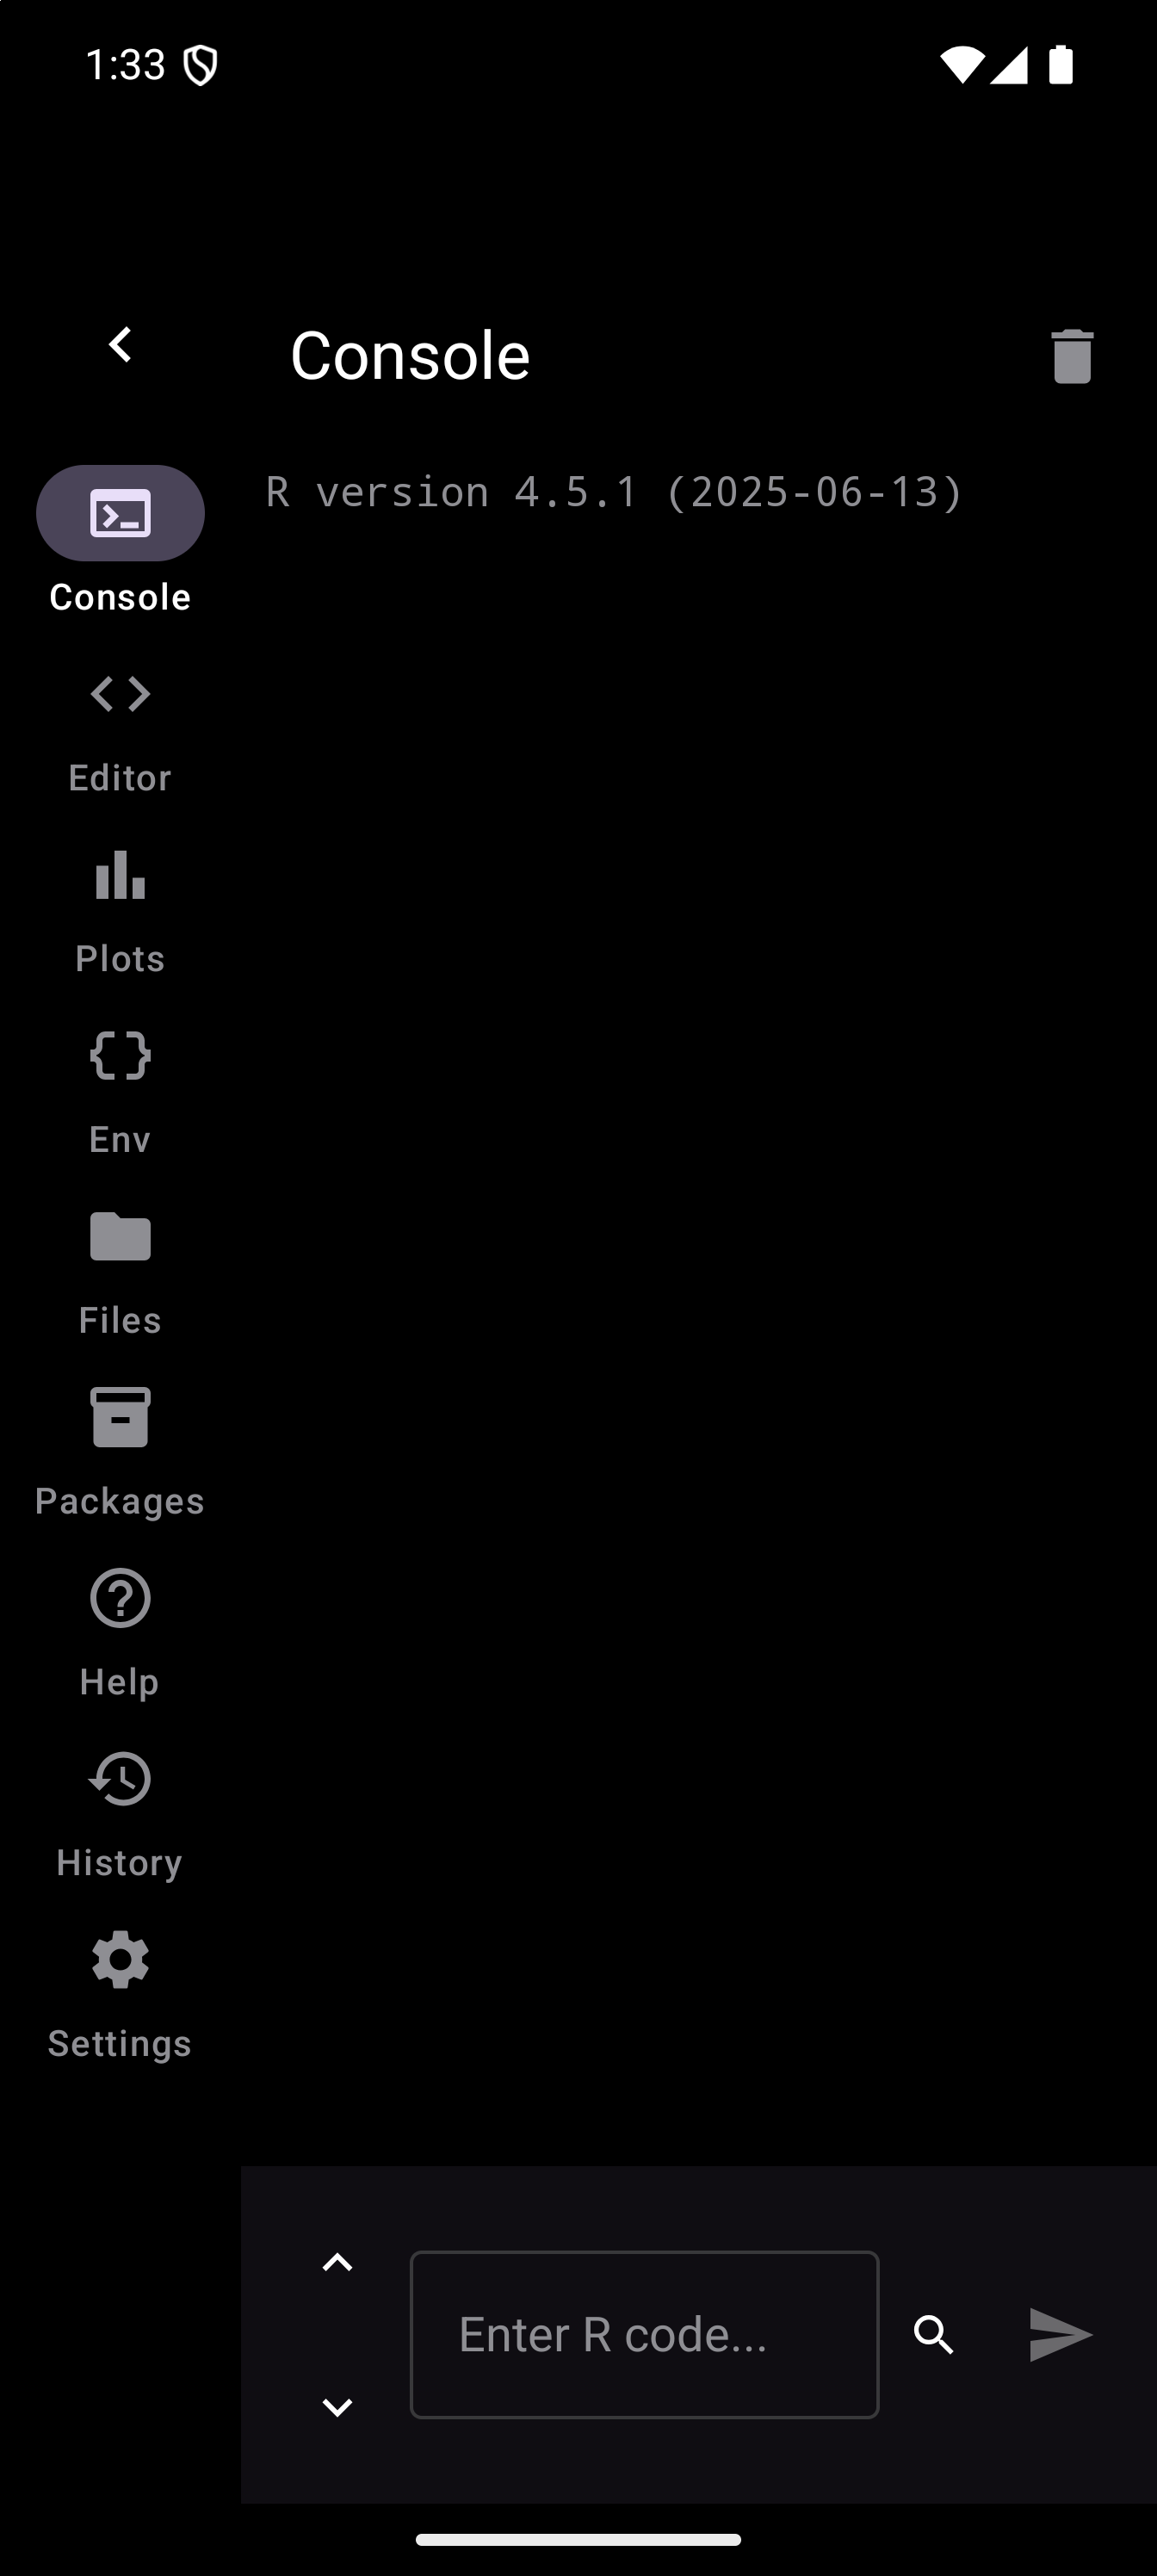
- A collapsible navigation rail on the left. The sidebar can be collapsed to give more room for content, and in a short window it scrolls, so every section stays in reach.
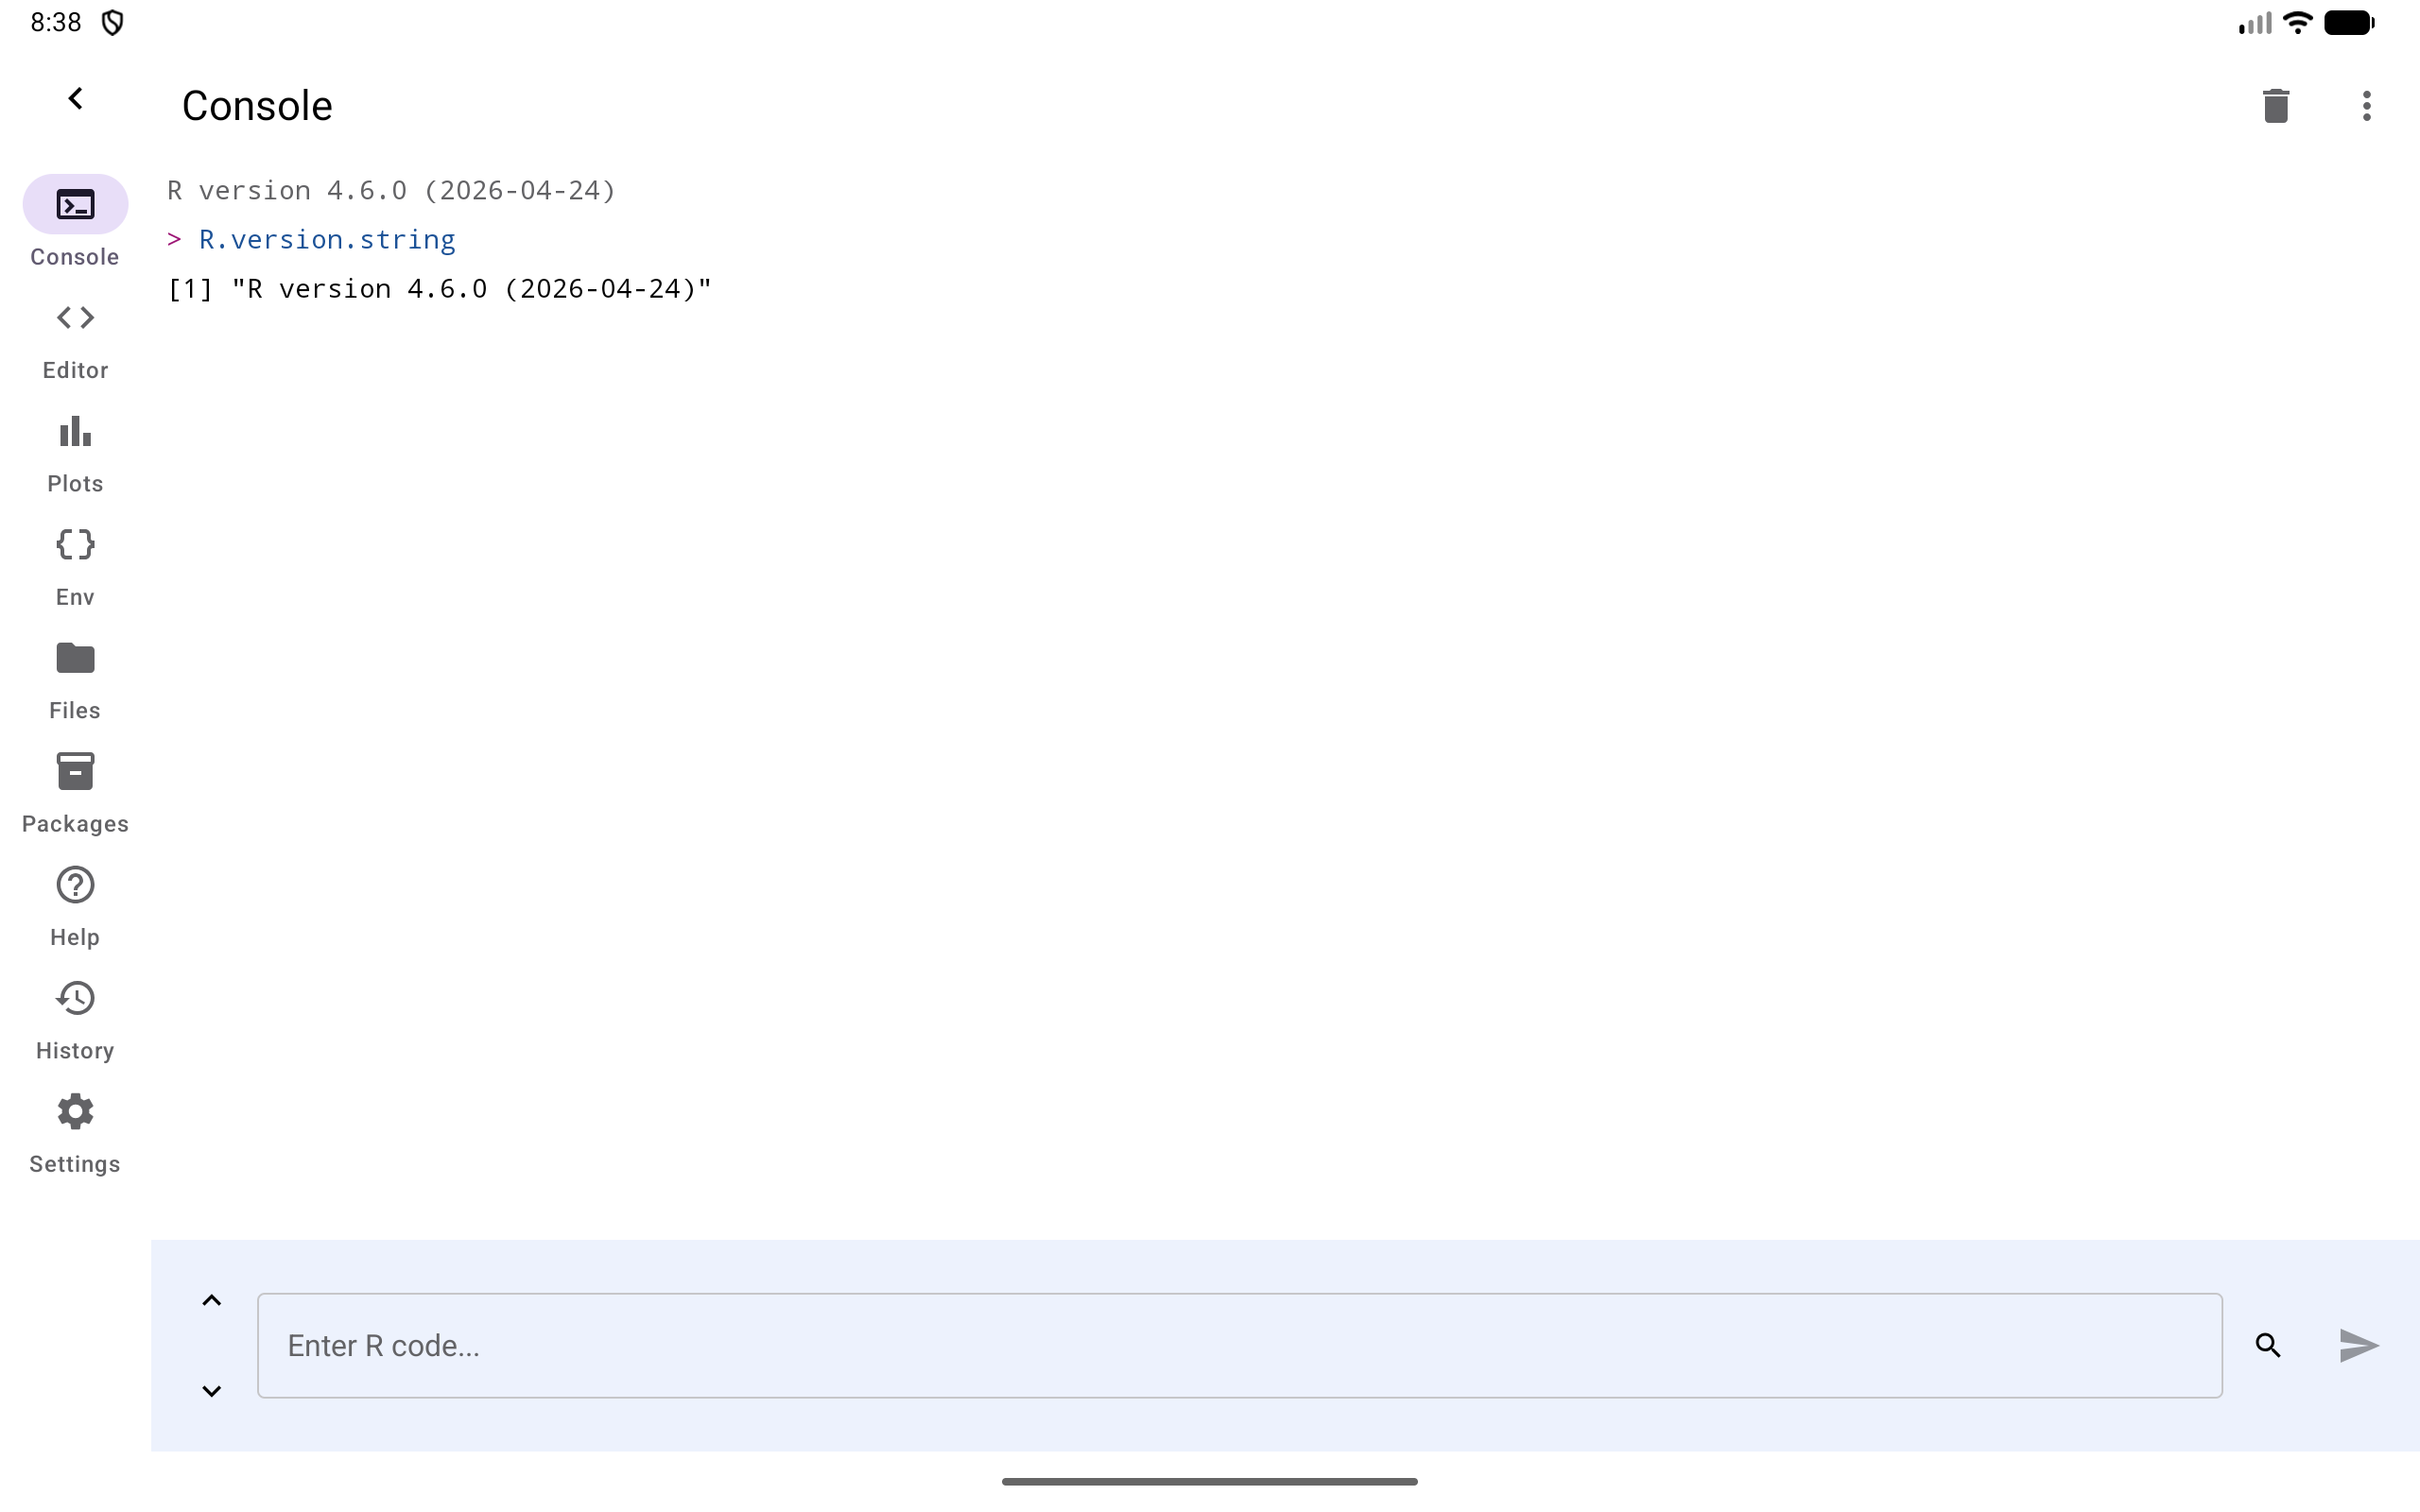
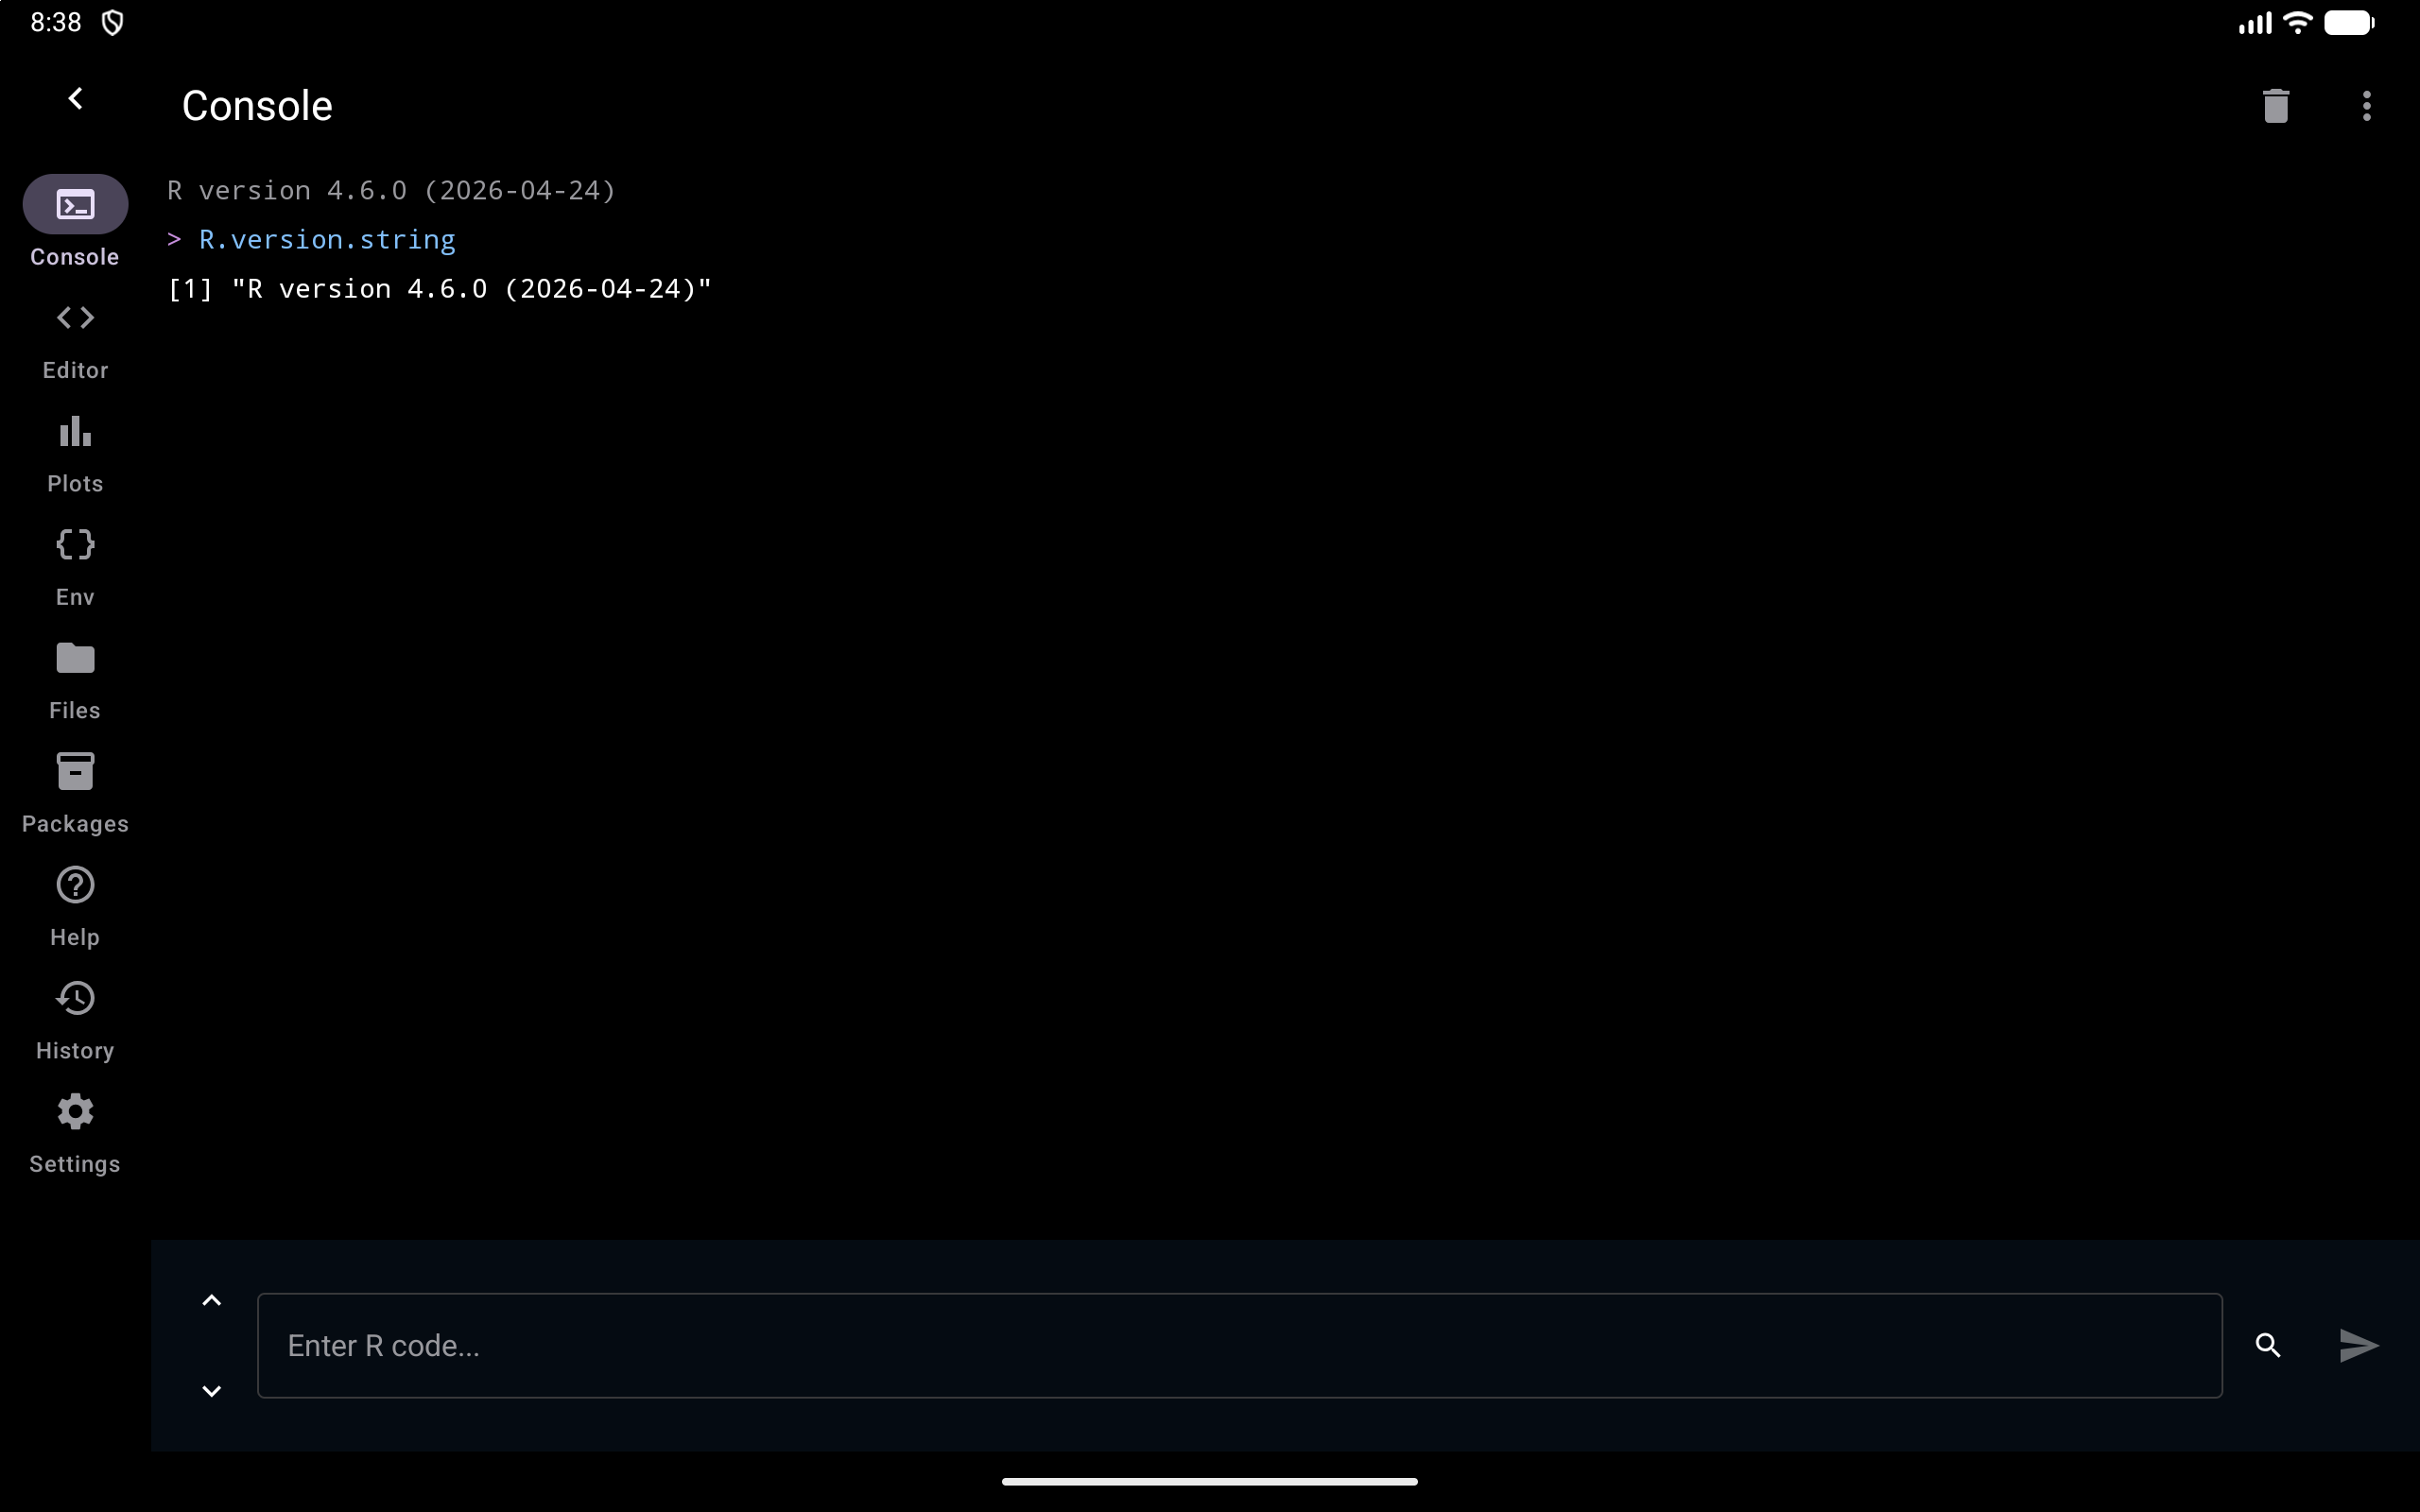
When collapsed, a narrow tab with an arrow at the left edge brings the sidebar back:
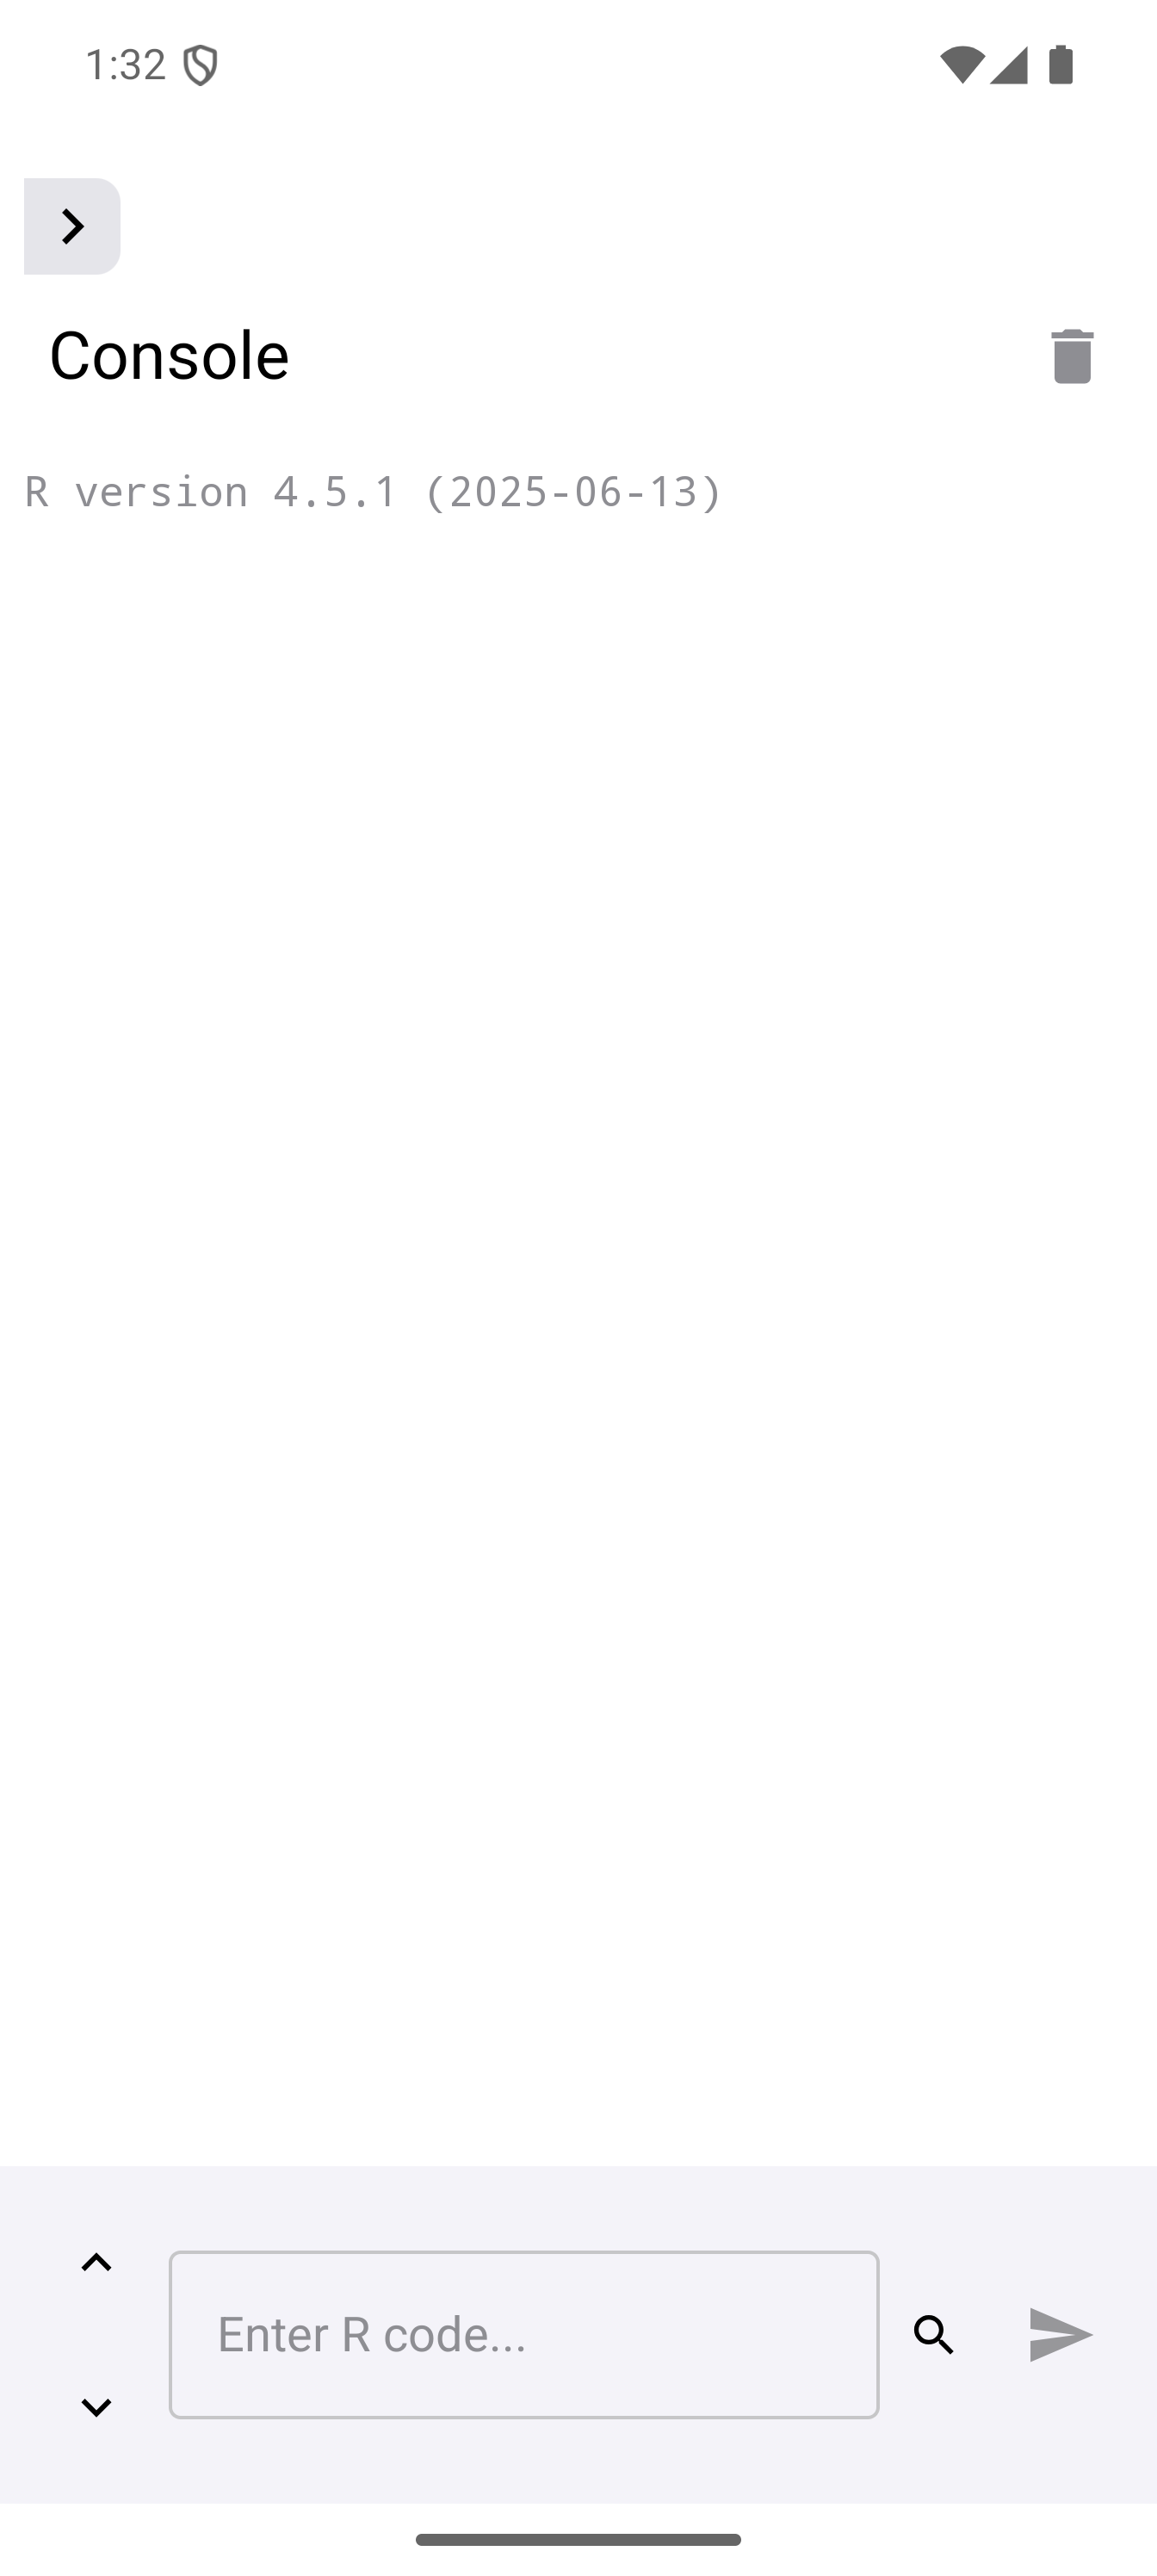
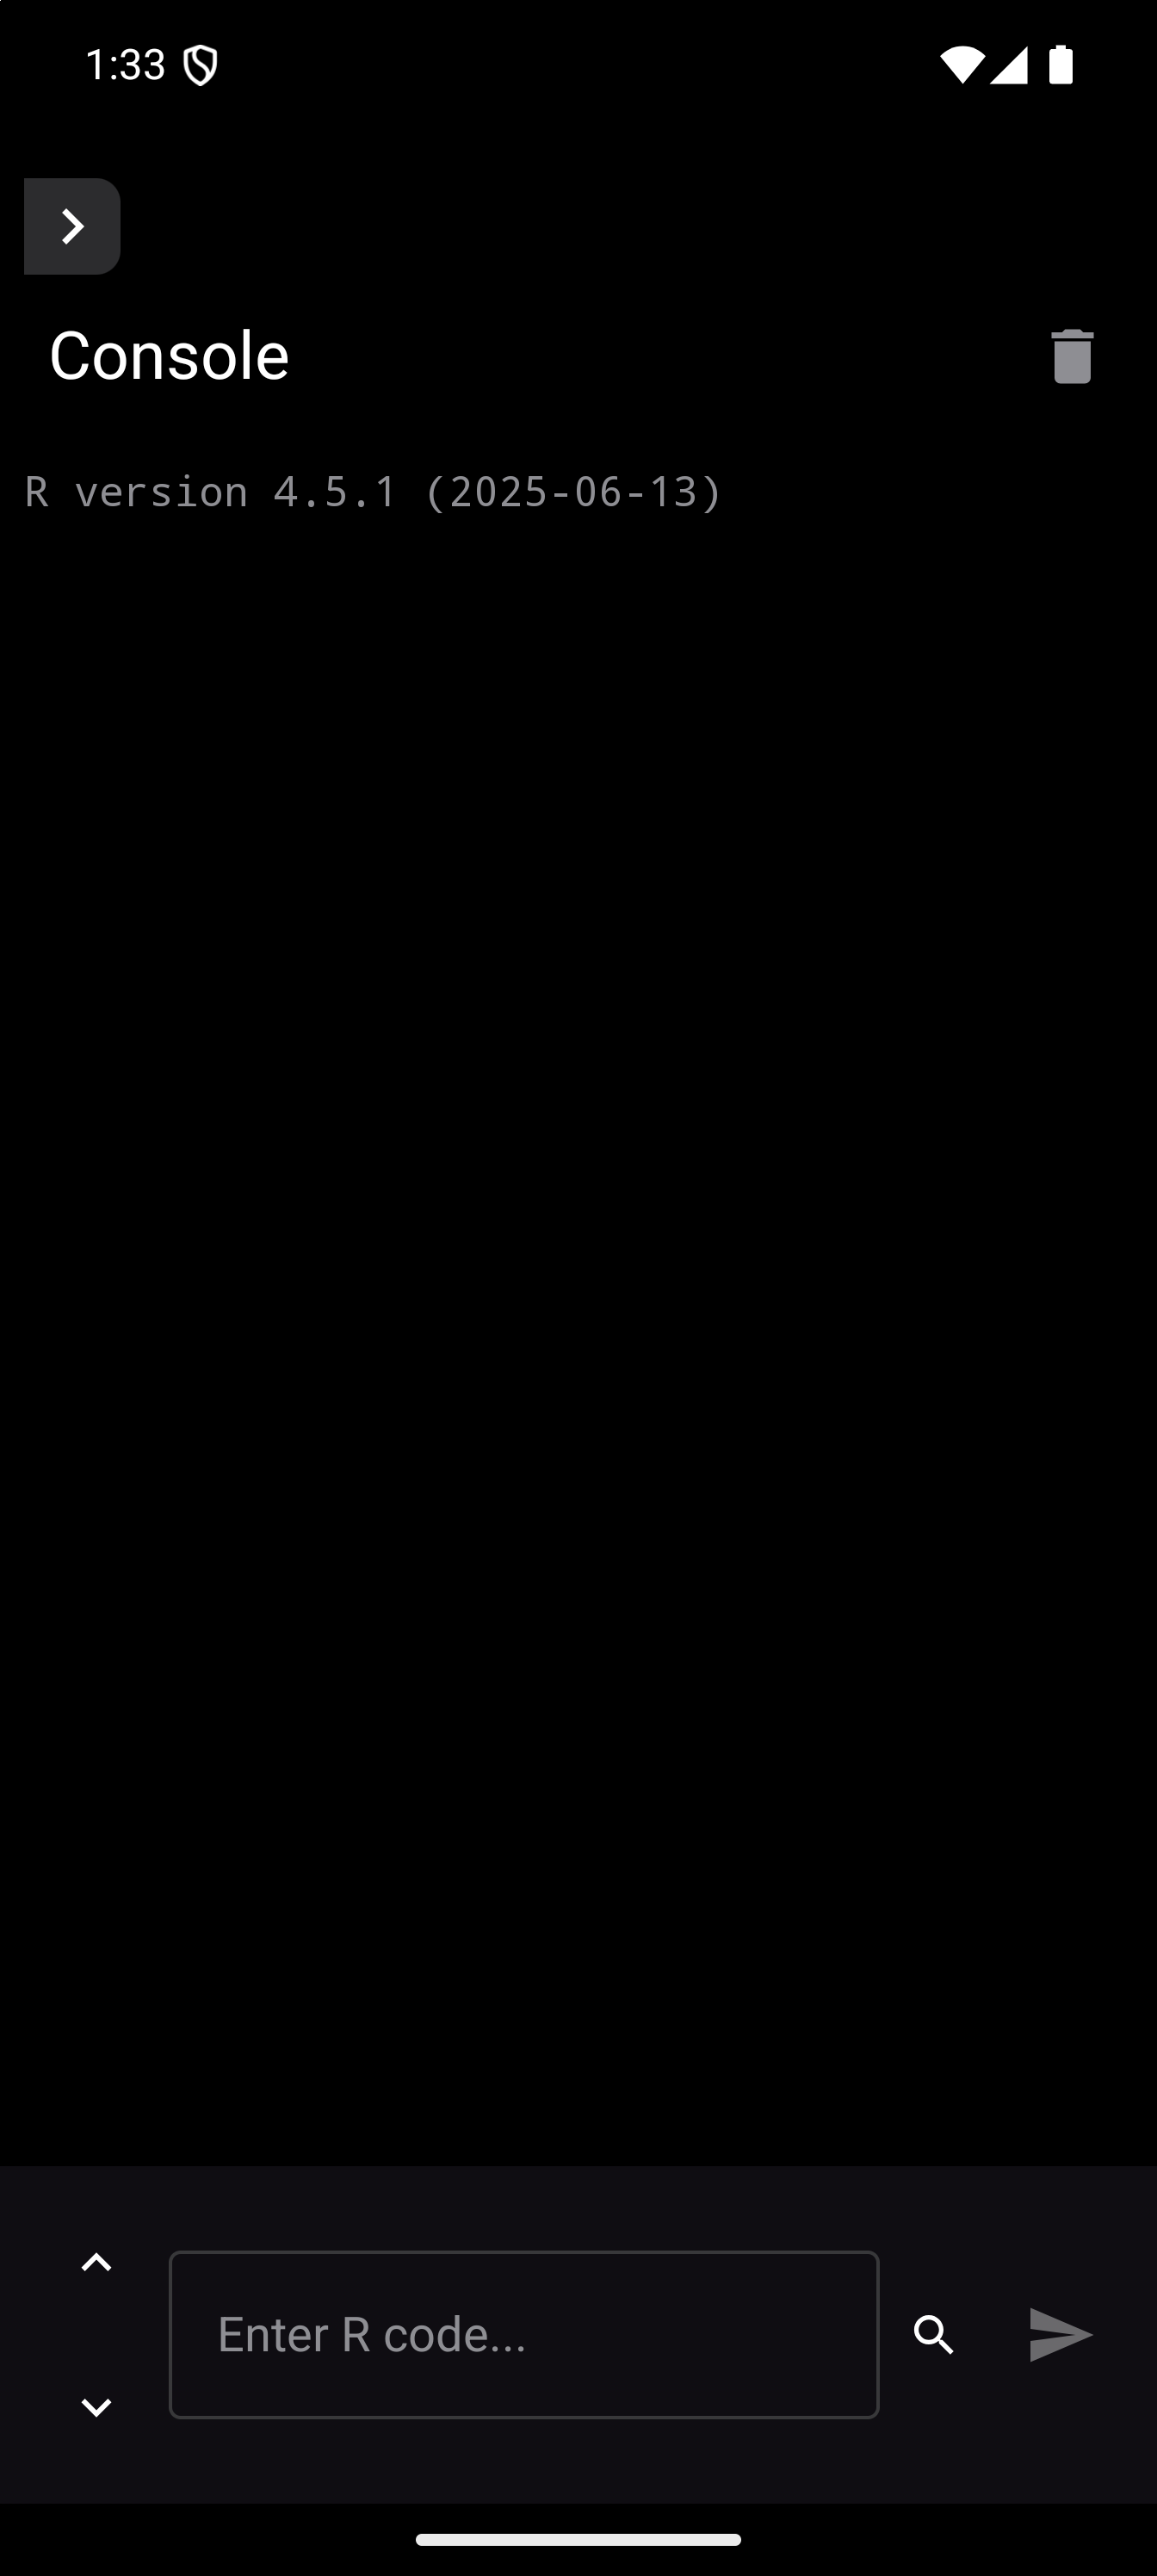
- Workspace (tablets only, and the default there)
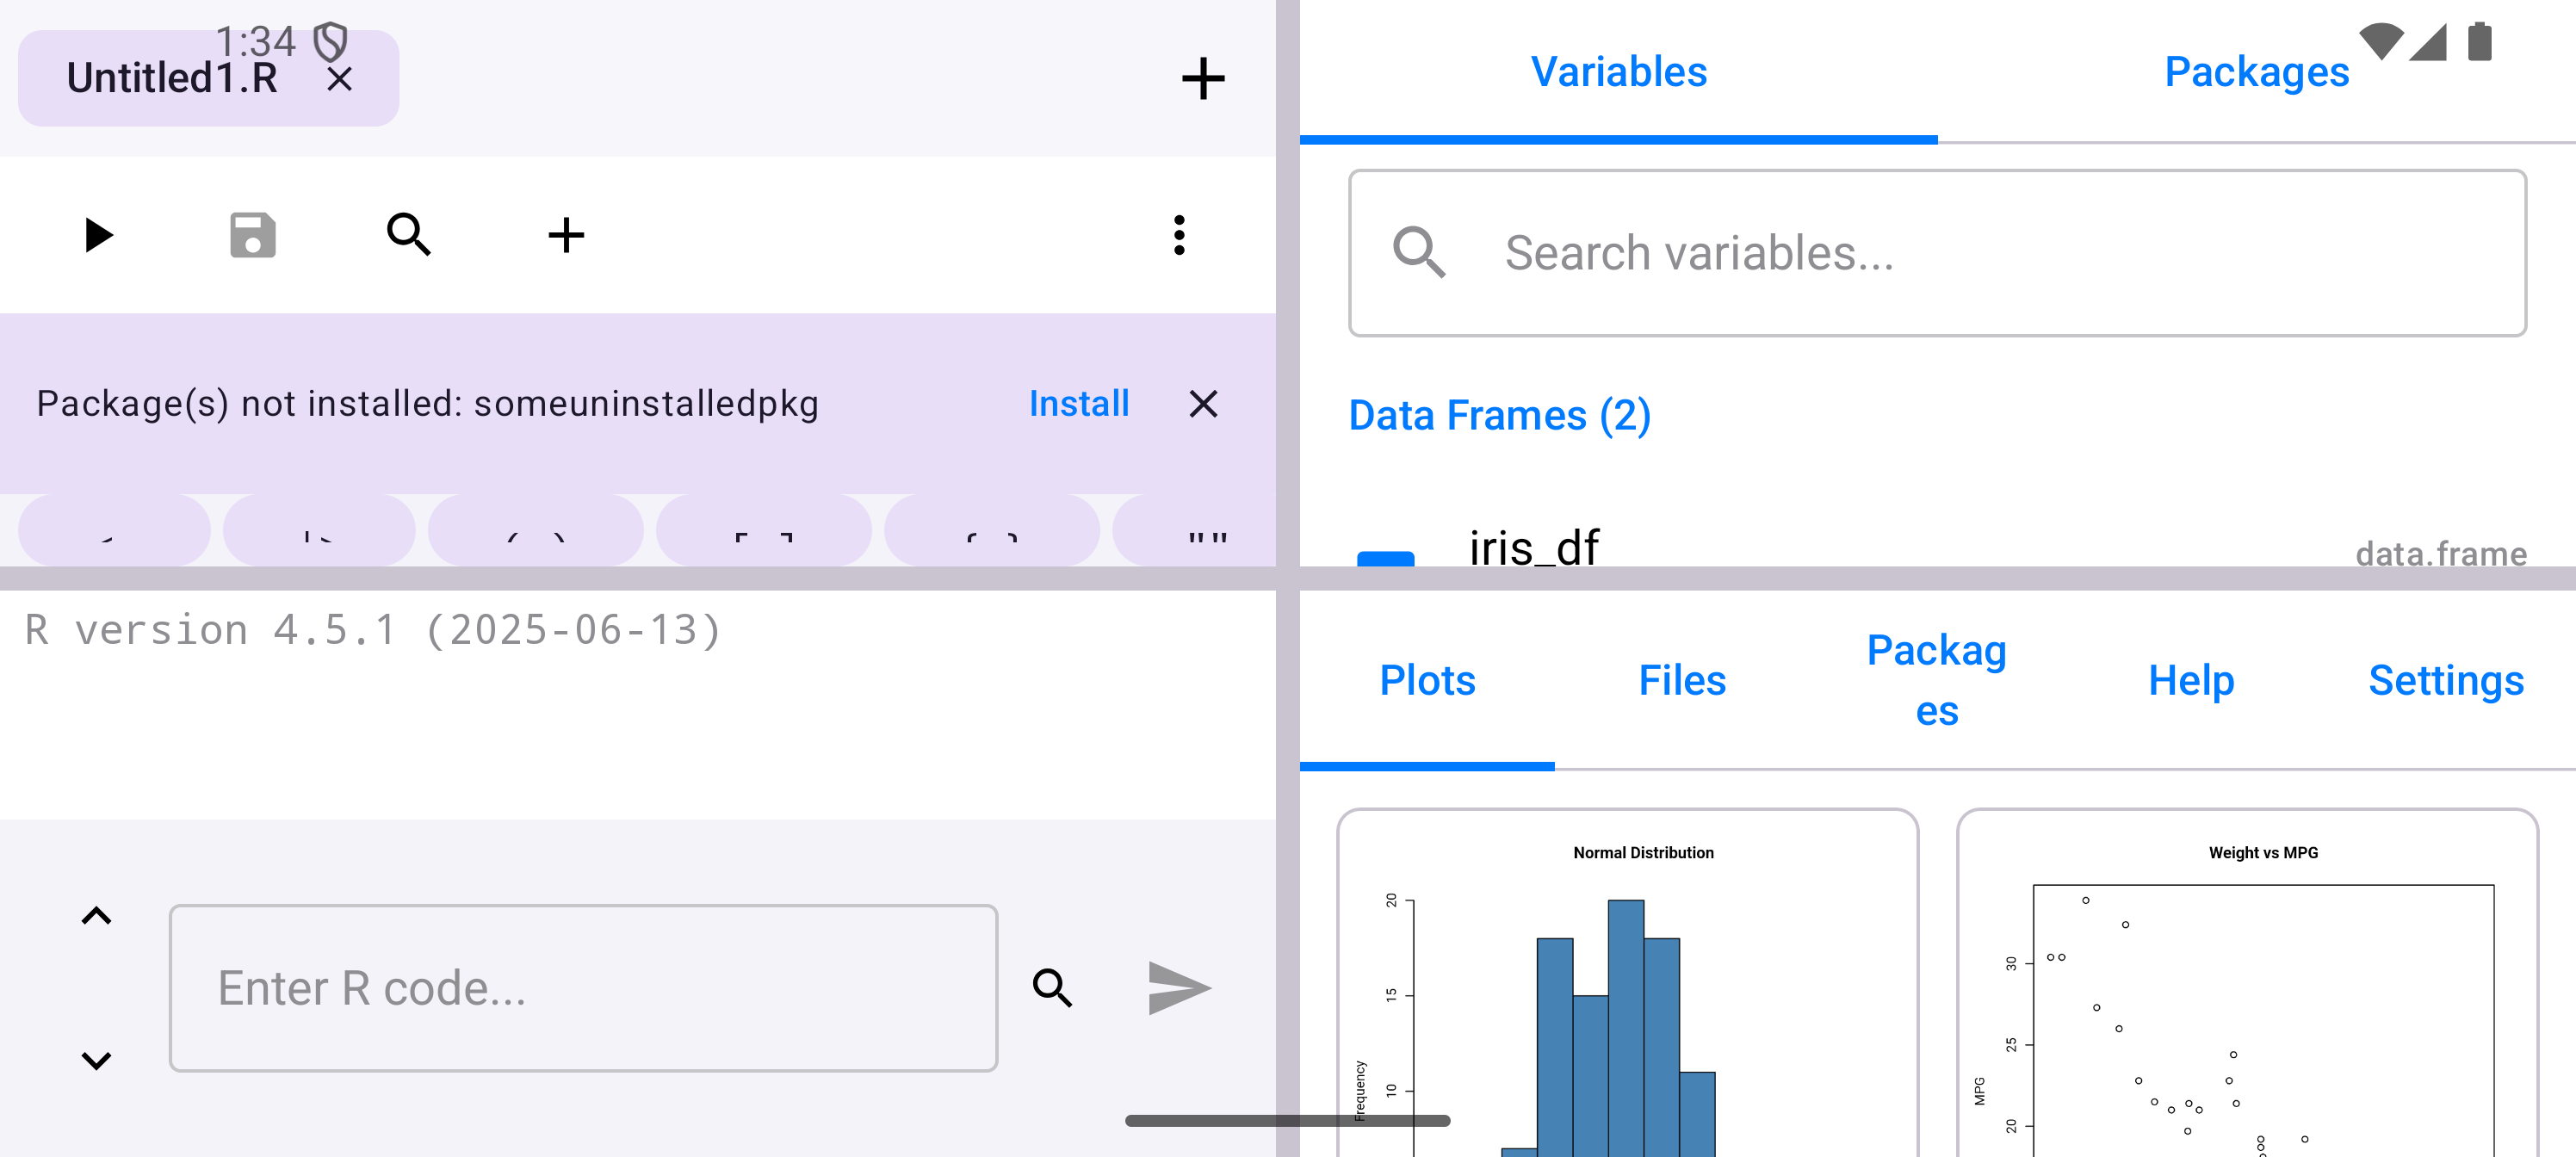
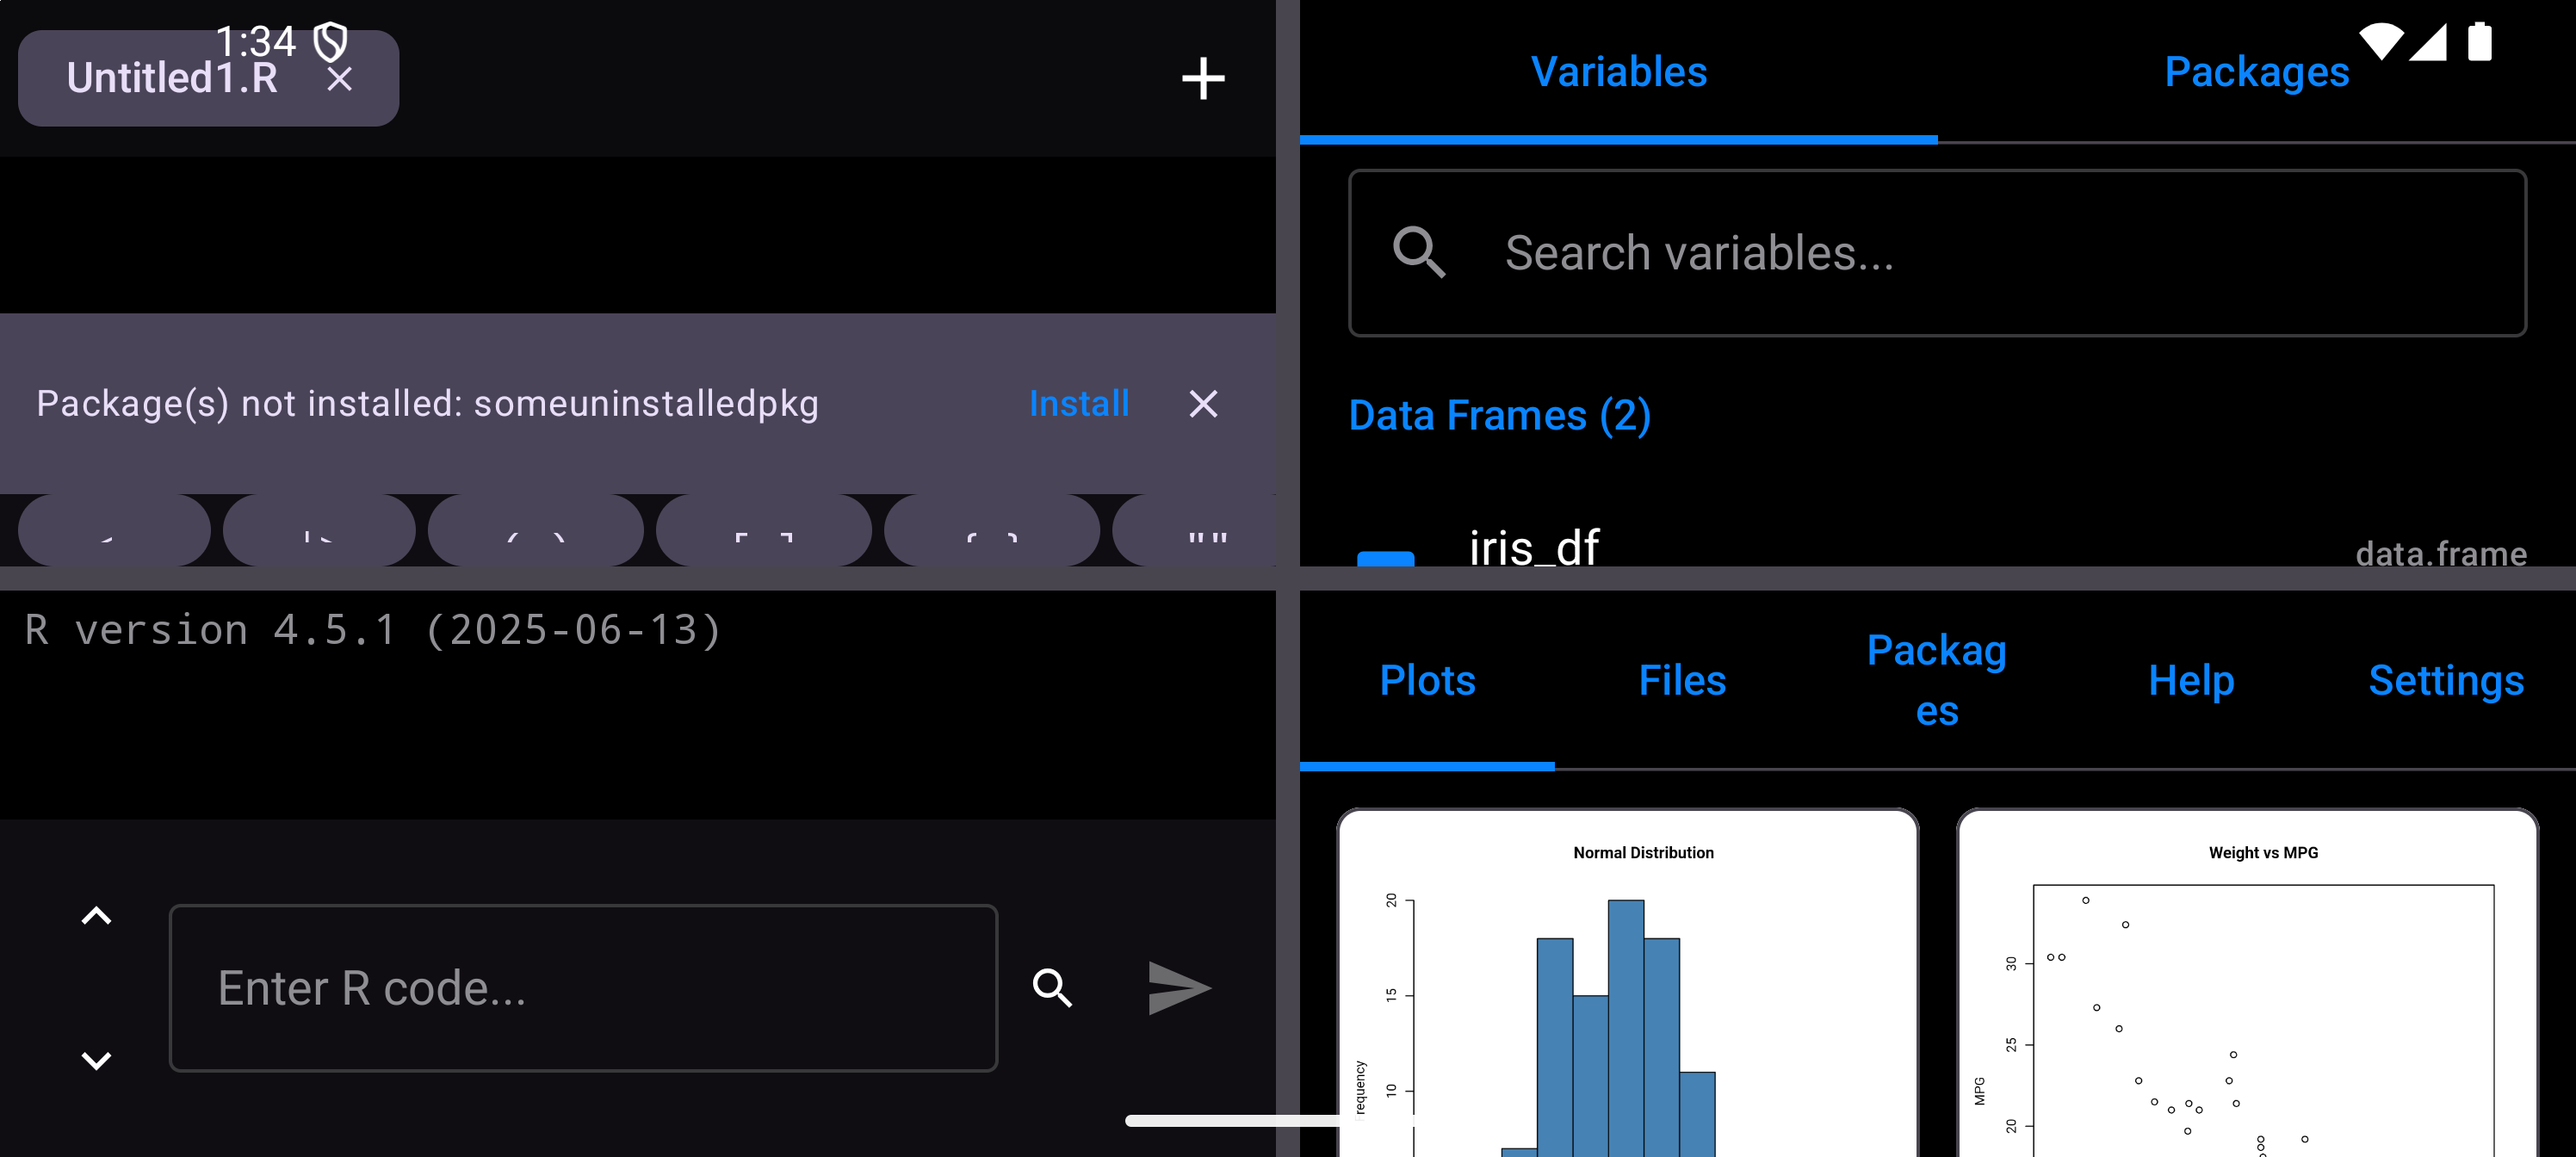
- A 4-pane layout with Console, Editor, Environment, and Plots all visible at once. It appears in Settings only on a screen at least 600dp wide (on a phone the four panes would be too cramped to use), so there is no phone version of the screenshots below. A new install on a tablet or Chromebook starts in it; an install updated from an earlier version keeps the layout it had, and a layout you pick is never replaced.
To change the layout mode:
- Open Settings (from the More menu in the navigation bar, or in the Workspace from the gear in the Environment pane’s header)
- Under Layout Mode, tap Tab Bar, Sidebar or Workspace (Workspace appears only on tablets)
- The app rearranges immediately
On a tablet, Workspace mode gives you the Console and Editor on the left, with Environment and Plots on the right. Tap Run in the Editor pane and your code runs in the Console pane below it, with each result under its line. You can drag the dividers to resize each pane, by touch, mouse or trackpad. With a keyboard, Ctrl+1 and Ctrl+2 move the cursor to the Editor and the Console.
Settings also lets you configure:
- Theme: System, Light, or Dark
- Plot Display: Tab Only, Floating, Sheet, or Inline
- Font sizes for the console and editor
Next Steps
You now have a working R environment on your Android device. Here is where to go from here:
Console
Learn about command history, keyboard shortcuts, and the R toolbar.
Editor
Write multi-line scripts with find/replace, code outline, snippets, and gist export.
Plots
View, zoom, pin, and share your R graphics.
Environment
Inspect variables, data frames, and memory usage.
Files
Manage scripts and data files on your device.
Packages
Install R packages from the webR repository.
Help
Browse R documentation with search, package labels, and context-aware help.
Themes
Nine built-in themes, custom theme editor, and VS Code / RStudio import.
Settings
Configure layouts, fonts, and plot display.
FAQ
Common questions and troubleshooting.